5 DNA methylation clocks in Alu Elements
5.1 Abstract
Alu repeat elements the most numerous repetitive sequence element in the human genome making up ~10.7% of total genomic sequence. Alus are generally repressed but contain features with the potential to have regulatory impact were they accessible. Loss of the repression of repetitive elements is thought to occur with age, due in part to a reduction in global DNA methylation levels driven by repeats. This change in DNA methylation in repetitive elements with age may capture information about biological ageing not captured by other such DNA methylation based predictors. Age predictors trained using elastic net regression on MeDIP-seq data for Alus (n = 774) were able to predict the age of an unrelated set of (n = 664) individuals with and R of 0.65 and a median absolute error of 8.1 years. The Alu age estimators were prone to overestimating the age of older samples and underestimating the age of younger samples. The difference between predicted age and chronological age, the Alu age acceleration was used to perform GWAS. The top 4 SNPs common between GWAS for 2 different Alu age predictors showed associations with phenotypes plausibly related to biological ageing. However, Alu Age acceleration was observed to be strongly correlated with Chronological age rendering it difficult to separate genetic associations with Alu age acceleration from those with chronological age. This association may be due to the relatively poor quantitation of absolute methylation levels by MeDIP-seq resulting in bias in the age prediction model.
5.2 Introduction
As we age biological systems from the molecular to the macroscopic undergo functional decline. This increasingly impaired function with time results in increased risk for a wide variety of chronic disease states and indeed for co-morbidities with these conditions [288]. Among the molecular changes that occur with age are alterations to the epigenome [30].
Approximately 45% of the human genome is comprised of repetitive or transposable elements [404,405] (Figure 5.1). The repression of these elements to prevent their expansion or the impact of their latent regulatory potential from effecting genomic stability and regulation is a core function of epigenetic mechanisms [406]. The most common DNA modification, 5-methylcytosine (5mC) at CpG loci, exhibits the most well documented age-related changes, and plays a central role in the repression of repetitive and transposable elements [11]. DNA methylation also classically functions to repress gene expression at promoters [407], similar to the repressive role that is plays at repetitive elements. Beyond solely repressive effects, DNA methylation in gene bodies can modulate expression [408] and influence splicing patterns [409].
![Proportion of the Human genome given over to different repeat classes ‘Rest’ indicates the non-repeat features. Reproduced form Jorda et al. [410] Figure 1 b.](figs/Jorda_Peinado_prop_repeats.png)
Figure 5.1: Proportion of the Human genome given over to different repeat classes ‘Rest’ indicates the non-repeat features. Reproduced form Jorda et al. [410] Figure 1 b.
Demethylation of repetitive elements is thought to be a major contributor to the global decreases in bulk 5mC with age [138,411]. Some regions of the genome show increasing DNA methylation with age, notably, the promoters of polycomb target genes [155], bivalent chromatin domains [153] and specific tRNA genes Chapter 4 [1].
Alu elements are the single most abundant transposon in the human genome with ~1.19 million copies and comprising ~10.7% of the total genomic sequence [412,413]. Alu elements are members of the short interspersed nuclear elements (SINEs) family of non-LTR retrotransposons, are ~300bp in length, and are derived from the 7SL RNA gene [414]. SINEs are non-autonomous, unlike LINEs (short interspersed nuclear elements) they do not encode their own reverse transcriptase (RT) but instead replicate making use of an RT encoded in an active LINE element, such as one of the small number of active LINE-1 elements [413,415]. The Alu elements arose from the 7SL sequence via the FAM sequences, which gave rise to truncated variants, FRAM and FLAM the fusion of which yielded the current dimeric Alu sequence [416].
![Structure of an Alu element A complete Alu element contains the A and B box sequence elements from an RNA polIII promoter, a central A rich region, a short insertion in the right arm, and a poly A region involved in retrotransposition and insertion. There is not an explicit polIII terminator in the Alu sequence so transcription continues through arbitrary flanking sequence until a run of at least 4 Ts, is encountered [417,418]. FLAM sequences are the origin of the Left arm and FRAMs the origin of the Right [416].](figs/AluStructure.png)
Figure 5.2: Structure of an Alu element A complete Alu element contains the A and B box sequence elements from an RNA polIII promoter, a central A rich region, a short insertion in the right arm, and a poly A region involved in retrotransposition and insertion. There is not an explicit polIII terminator in the Alu sequence so transcription continues through arbitrary flanking sequence until a run of at least 4 Ts, is encountered [417,418]. FLAM sequences are the origin of the Left arm and FRAMs the origin of the Right [416].
Alus are primate specific and arose ~65 million years ago (MYA), with a peak in amplification around ~40 MYA (Figure 5.3) [419]. Non-LTR retrotransposons, including Alu, L1 and SVA elements, are active in humans. Mutagenesis arising from Alu element insertion and Alu element mediated recombination is responsible for an estimated 0.4% of all human genetic disorders [405,420]
![Alu element Age and history of expansion in primates Mya (milion years ago). Reproduced from Batzer & Deininger 2002 [418].](figs/Batzer2002_fig2_Alu_age_expansion.png)
Figure 5.3: Alu element Age and history of expansion in primates Mya (milion years ago). Reproduced from Batzer & Deininger 2002 [418].
Alu elements are CpG rich (Figure 5.4), accounting for ~7.5 million CpGs, or ~25% of all human CpG sites (Figure 5.5) [413]. High levels of DNA methylation predominate at Alu elements across normal tissues. Furthermore Alu elements are more resistant to hypomethylation than other repetitive elements in cancer cells. This is indicative of strong pressure to maintain their repressed state [410].
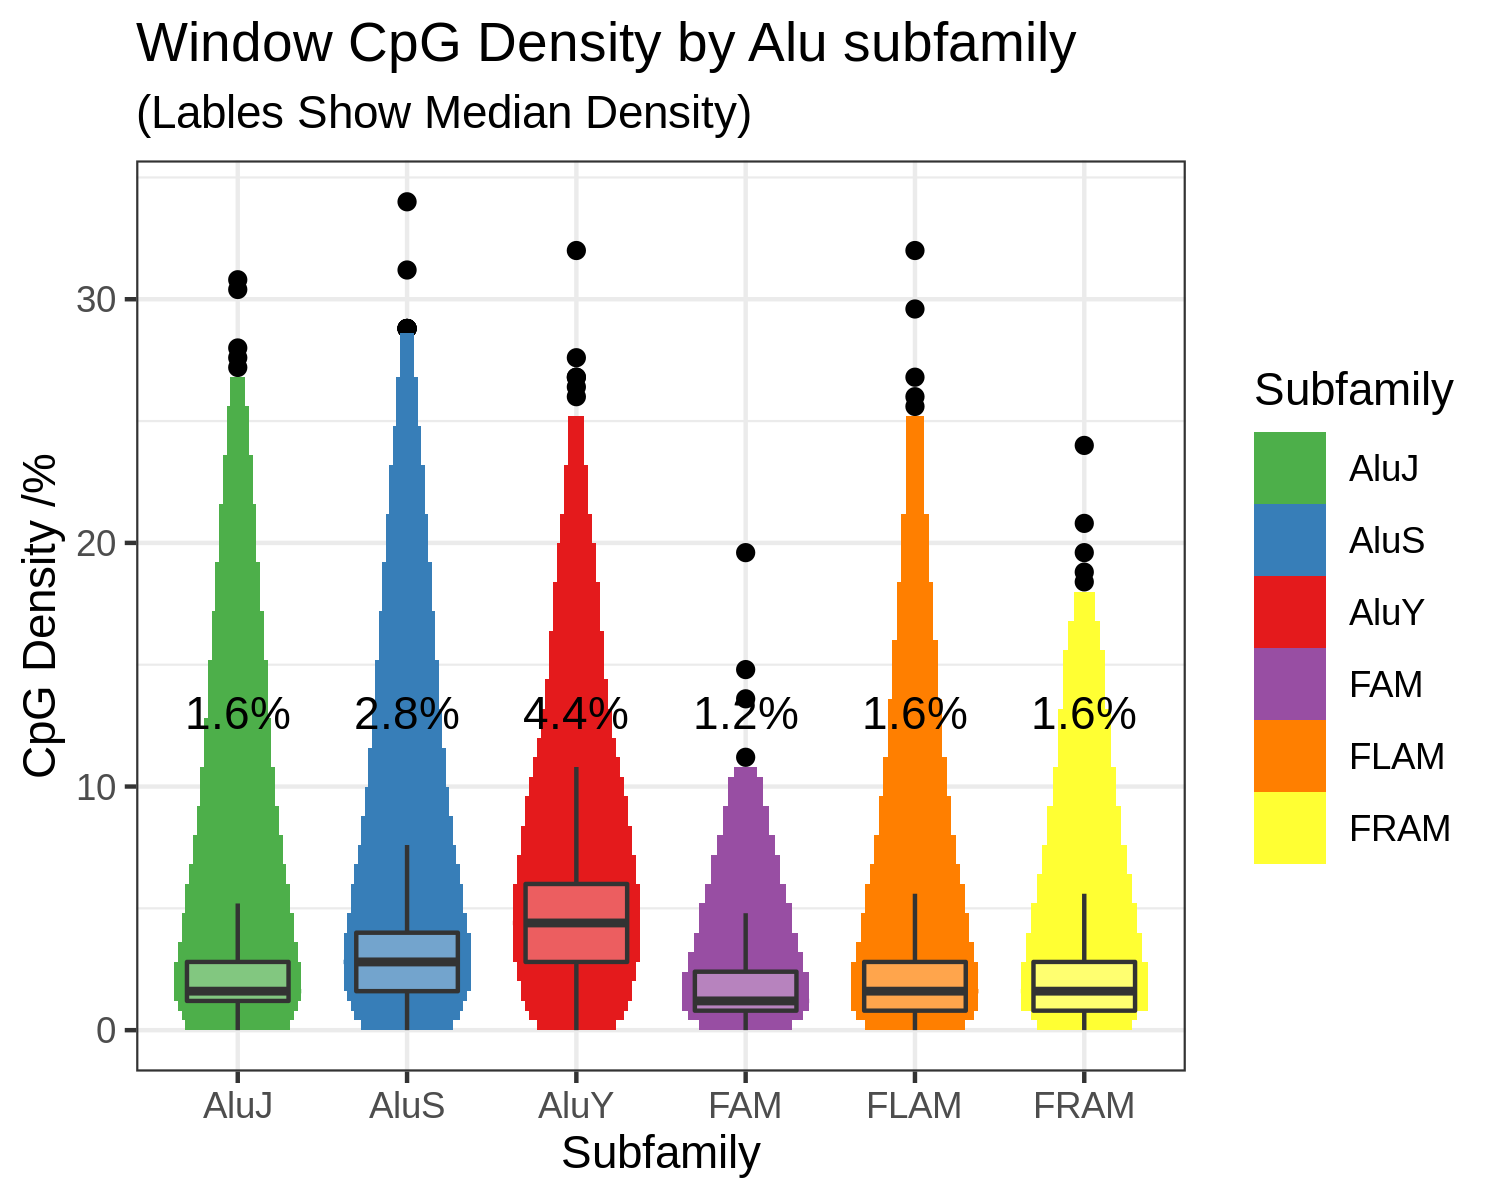
Figure 5.4: Alu elements are CpG dense FAM, FLAM and FRAM sequences are the precursors which gave rise to the modern Alu families, they are less CpG dense than the AluS and AluY families and closer to the global average of ~1.8% Chapter 1.4.2.
Alu elements contain many sequences with the potential to effect gene regulation, and indeed do effect gene expression [421,422]. There are numerous TFBSs in the canonical sequences of elements in the Alu family [423], and some may possess enhancer activity [424]. DNA methylation levels at transcription factor binding sites (TFBS) modulate the binding affinity of transcription factors for these sites [425,88]. Thus deterioration in the effectiveness of the repression of Alu elements has the potential to disruptively expose this latent regulatory function [426,290,427,428]. Epigenetic reactivation of cryptic cis-regulatory elements (CREs) within transposons has been show to act as an oncogenic driver [429], including specifically from Alu elements [430]. Alu element methylation has also previously been correlated with age-related phenotypes. Hypomethylation of Alu elements in blood cells has been associated with increasing age and with lower bone mass [431]. Alu and LINE-1 elements were more methylated in the circulating cell-free DNA of women with an older age an menopause [432]. De-repression of Alu elements also has the potential to influence common non-malignant diseases including neurodegenerative and auto immune conditions [290,433].
Statistical methods for sparse regression analysis combined with quantitative assays of DNA methylation with high positional resolution, which cover a large number of loci, have permitted the construction of ‘DNA methylation clocks‘ which predict chronological age with a high degree of accuracy [293,434]. The difference between chronological and predicted age know as the ’age acceleration’ has been found to capture aspects of biological ageing in a number of these clocks. For example, Age acceleration is a strong predictor of all-cause mortality [190]. Whilst DNA hypermethylation and hypomethylation are driven by distinct mechanisms [435,101] CpGs undergoing these processes are approximately equally represented in DNA methylation clocks. Interestingly however, hypomethylating CpGs were identified by Zhang et al. to be the most indicative of biological ageing-related all-cause mortality effects in blood [436]. Most DNA methylation clocks constructed in humans have been constructed using the Illumina bead chip array based DNA methylation assays. The coverage of these assays is strongly focused on promoters [154], CpG islands [162], and more recently enhancers [210]. However, array coverage of repetitive elements is lacking due in part to the technical challenges of accurate mapping in these spaces [434]. Despite this, a small number of CpGs in repeat elements are present in existing DNA methylation age clocks (Figure 5.5). Thus, much of the genomic hypomethylation goes uncovered by the assays most commonly used to construct human epigenetic clocks.
![Comparison of the overlap of different repeat classes [437] with four DNA methylation clocks (Horvath clock [168], Hannum et al. clock [167], PhenoAge clock [193], epiTOC clock [372]) as well as Illumina array CpGs (27k [154], 450k [162], EPIC [210]) and all CpGs in the genome. Reproduced from Bell et al. [434] figure 2H.](figs/Bell_2019_Clock_repeats_CpG.png)
Figure 5.5: Comparison of the overlap of different repeat classes [437] with four DNA methylation clocks (Horvath clock [168], Hannum et al. clock [167], PhenoAge clock [193], epiTOC clock [372]) as well as Illumina array CpGs (27k [154], 450k [162], EPIC [210]) and all CpGs in the genome. Reproduced from Bell et al. [434] figure 2H.
In this study elastic net regression models were used to construct age predictors comprised of the DNA methylation state of Alu elements [438]. DNA methylation data at Alu elements was drawn from a MeDIP-seq dataset described in the Methods Chapter 2. Alu-specific DNA methylation ageing clocks were constructed and compared to other clocks’ measures.
5.3 Methods
5.3.1 DNA methylome data
The Methylated DNA Immunoprecipitation sequencing (MeDIP-seq) data was processed as previously described [209,107] and detailed in Methods 2.2. These processed data are available from the European Genome-phenome Archive (EGA) (https://www.ebi.ac.uk/ega) under study number EGAS00001001910 and dataset EGAD00010000983 and were generated by BGI Shenzen for TwinsUK.
MEDIPS (v1.0) was used for the MeDIP-seq analysis [128].
This produced reads per million base pairs (RPM) values binned into 500bp windows with a 250bp slide in the BED format, resulting in ~12.8 million windows on the genome.
5.3.2 Alu element annotation and pre-filtering
Alu element annotations were taken from Repeat Masker [437], only Alus on the autosomes were considered. 2,758,588 500bp windows with a 250bp slide overlapped the 1,137,653 Alu elements annotated.
Technically problematic and genetically confounded Alu element loci were removed. Alu elements located in blacklisted 834 regions of the hg19 genome, as identified by Amemiya et al. [357] were excluded as candidate loci when constructing DNAm clocks. Alu elements overlapping known structural variants identified by the 1000 genomes project [439] were excluded as candidate clock loci. Alu insertion variants can alter splicing patterns, this can affect disease risk, for example a particular Alu insertion elevates the risk of multiple sclerosis [440]. Polymorphic Alu elements are disproportionately represented at disease associated loci in GWAS [433] Genetic variants which impact on the rate of biological ageing could confound DNA methylation ageing signal hence the exclusion of know polymorphic Alu Loci. Haplotype specific methylation peaks, in which a common disease associated genetic variant is predictive of DNA methylation state, were also excluded from the clock; Bell et al. identified 7,173 such regions [107]. To exclude loci with low coverage which are likely to be uninformative and noisy a zero filter was used. In quantile normalised data loci in which 0.1% or more of samples have an RPM value of 0 are excluded.
5.3.3 Elastic net regression
Bigstatsr was used to fit penalised regression models [438].
Elastic net regression with an \(\alpha\) = 0.5, and cross-model selection and averaging (CMSA) with 10 fold cross-validation was used.
This procedure obviates the necessity of selecting a \(\lambda\) regularisation hyperparameter.
CMSA generates model coefficient by averaging across coefficients generated by cross-validation [438,169,441].
Details of the training and replication set to which elastic net regression was applied are detailed in Sample Selection 5.3.4.
5.3.4 Sample Selection
Two training and two replication sets were created from the twin data so as to permit the training and replication sets to be unrelated. The training sets, which were permitted to contain singletons, contained 1548 individuals and the replication sets contained the 1308 individuals who where twins of those in the replication sets. The 1548 individuals in the training sets were randomly split into 2 groups of 774 the replication set for each training set was comprised of the twins of the other training set such that two training sets with unrelated replication sets could be constructed (Figure 5.6). Giving a total of 2856 individuals in all sets, 2617 were female and 239 male, sex was approximately equally distributed between sets with all sets being ~8% male.
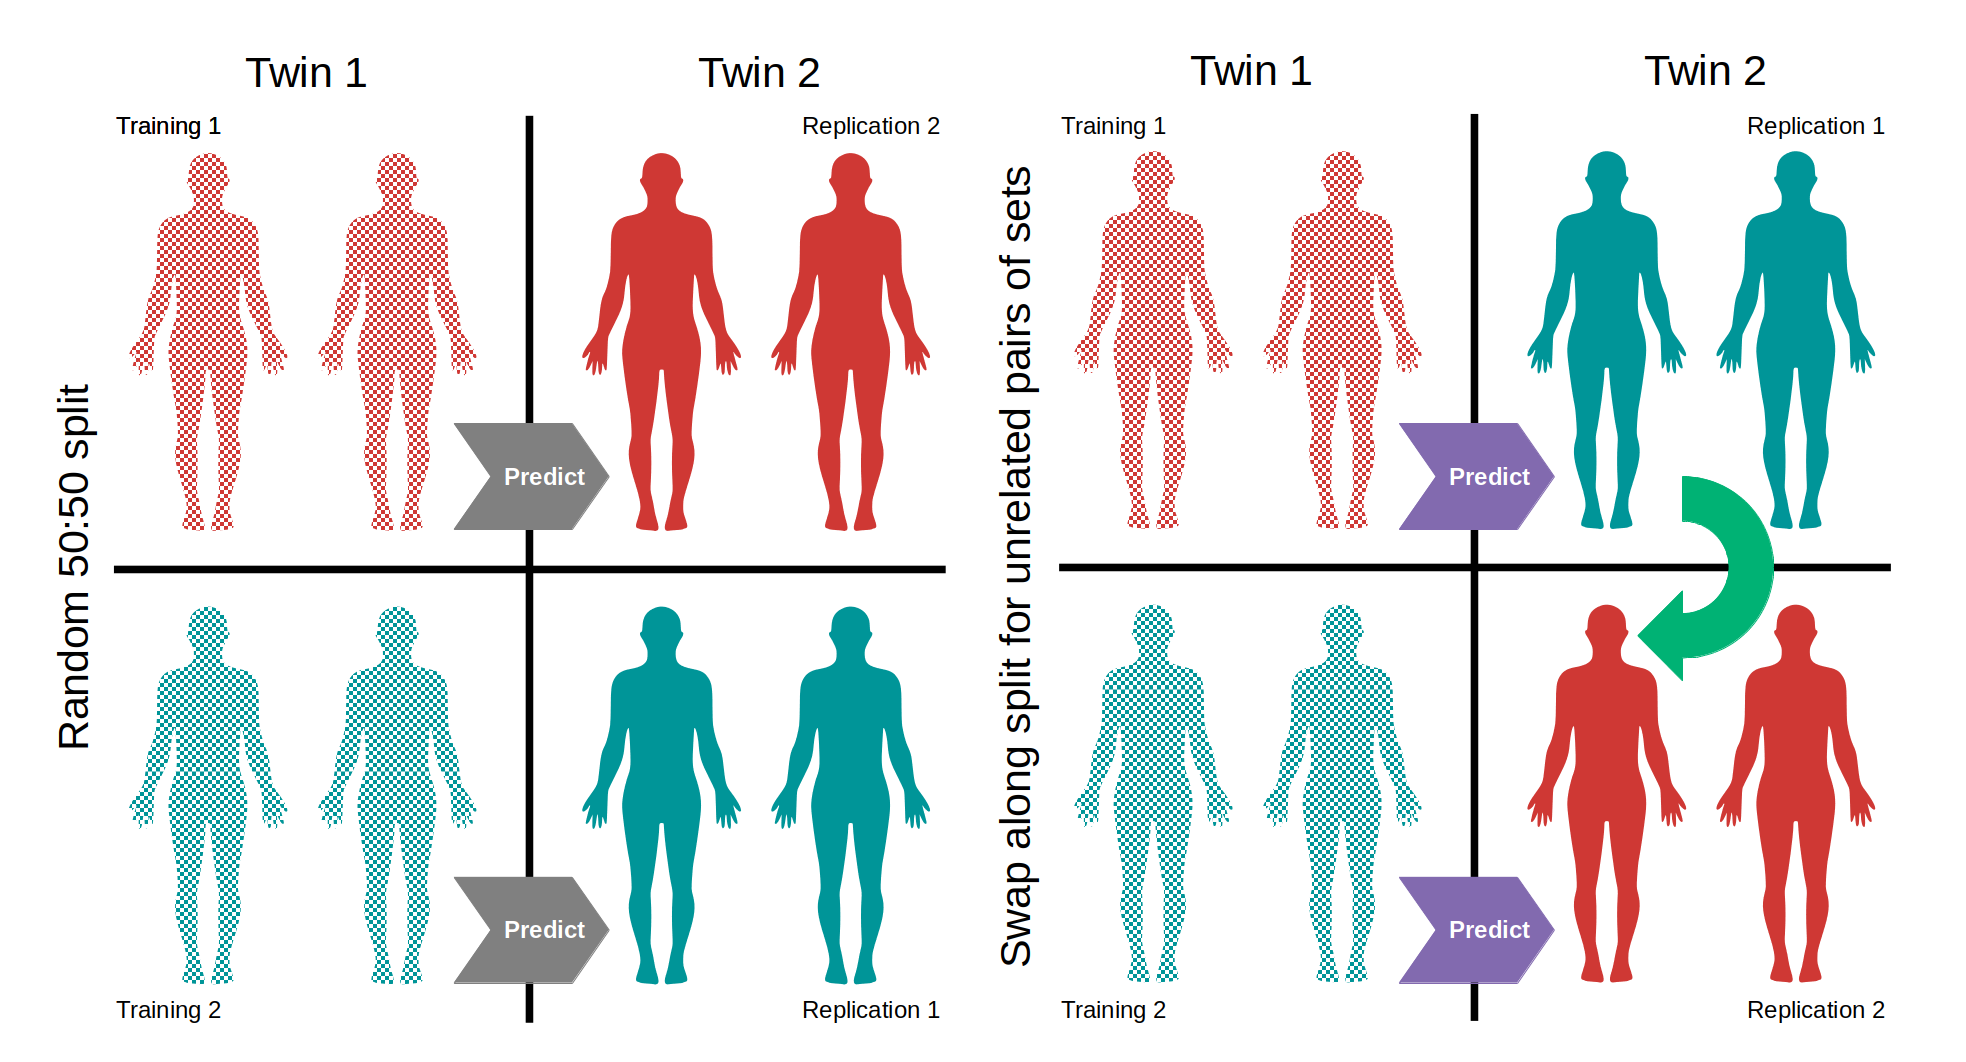
Figure 5.6: Construction of training and replication sets Twin pairs were split one twin in each group. The first group of twins was split into two groups with a random number generator. The twins of the individuals in one random half of the group were assigned to be the replication set for the other half, producing two sets of unrelated training and replication groups. Models were also used to predict the age of related individuals to gauge the effect of genetic factors on the predictive power of the models.
The age distribution of these training and replication sets are highly similar (Figure 5.7).
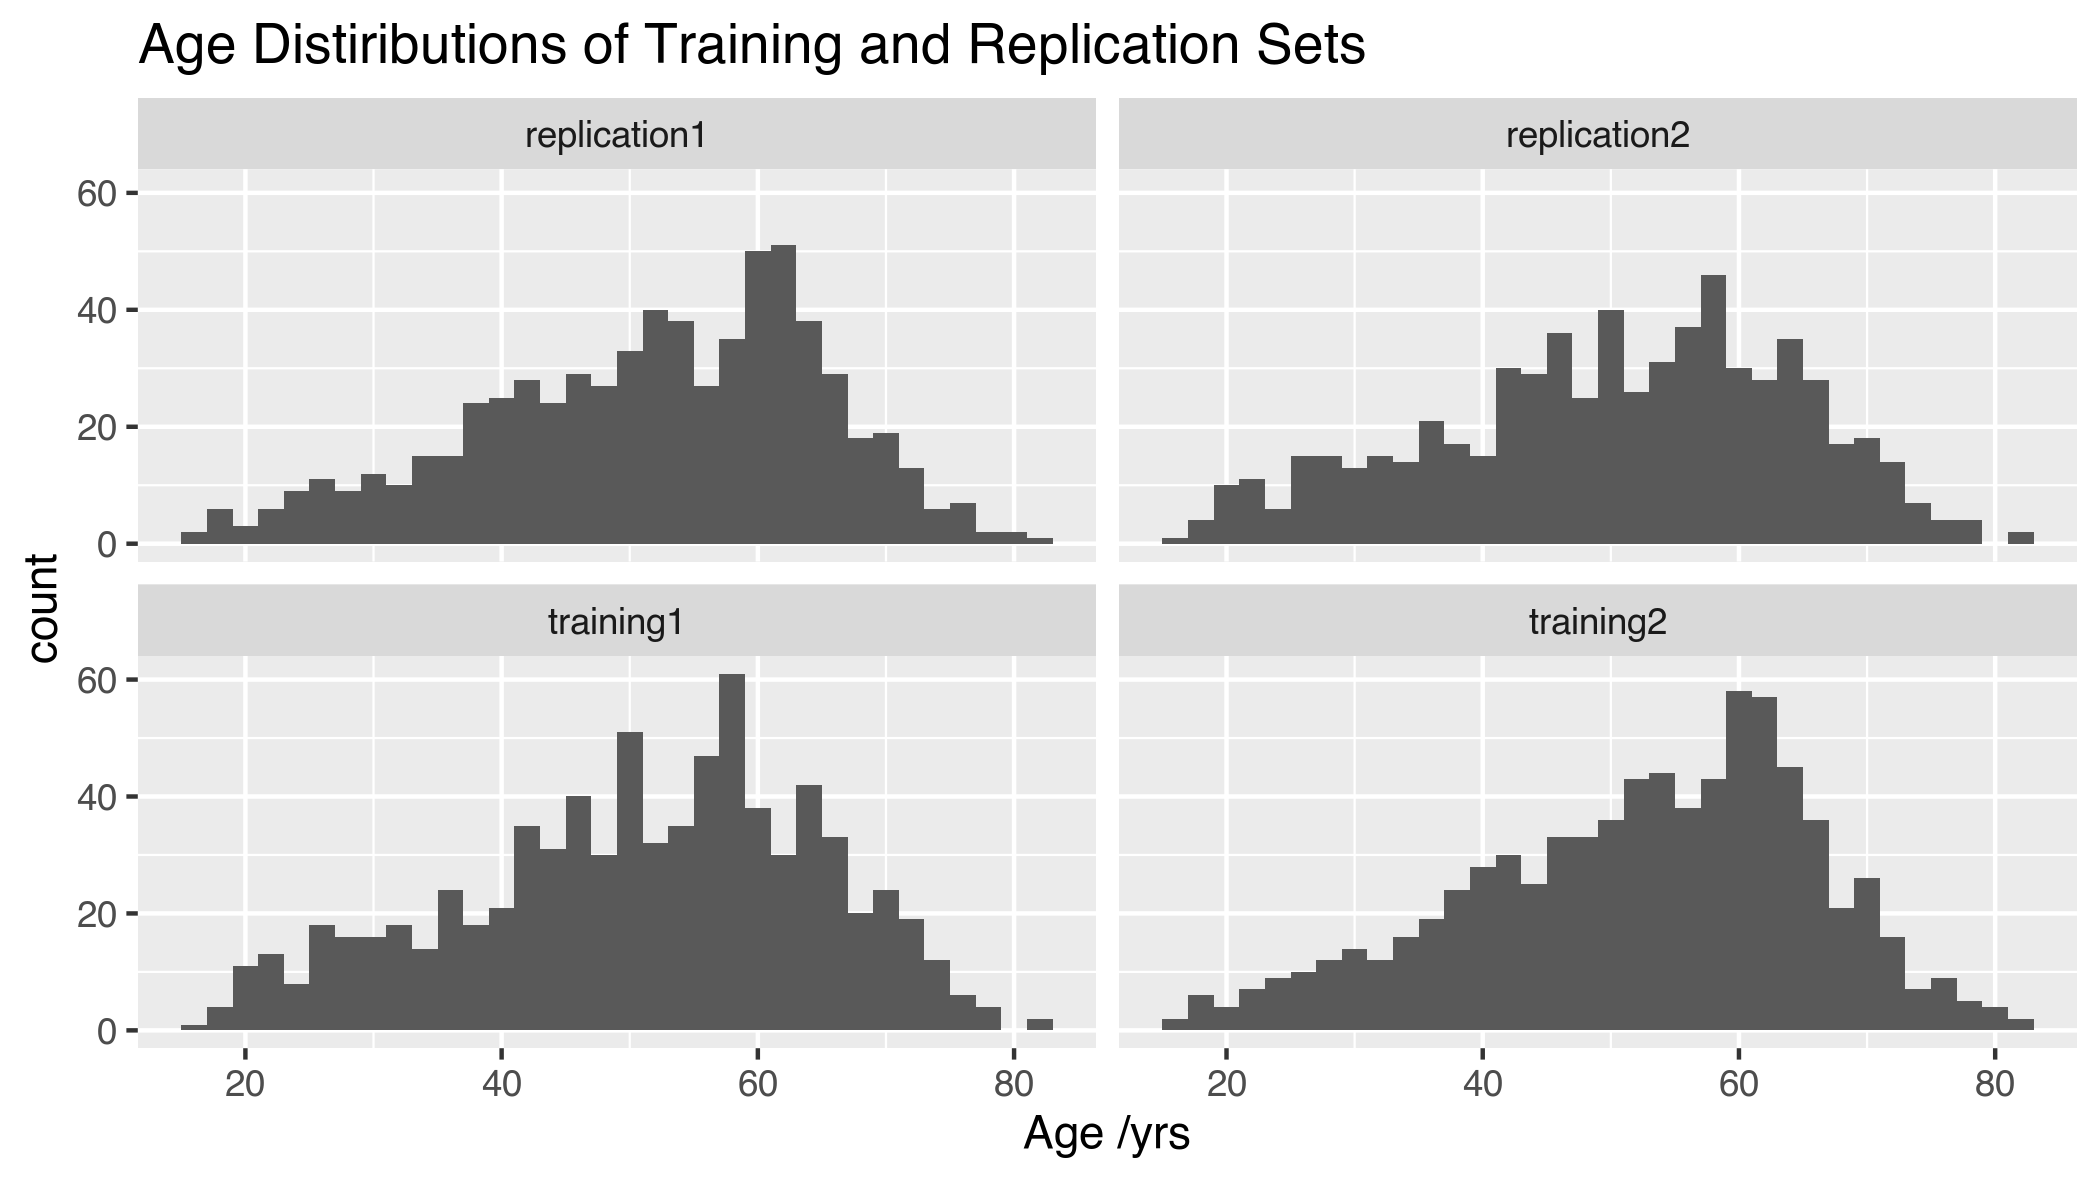
Figure 5.7: Age distribution of training and replication sets Training 1 (n = 774, 64M/710F); Training 2 (n = 774, 65M/709F); Replication 1 (n = 664, 55M/609F), unrelated to Training 1; Replication 2 (n = 644, 55M/589F), unrelated to Training 2. M = Male, F = Female
All sets are comprised of ~2/3 Monozygotic (MZ) twins and ~1/3 Dizygotic (DZ) twins, (exact numbers are detailed in Figure 5.8).
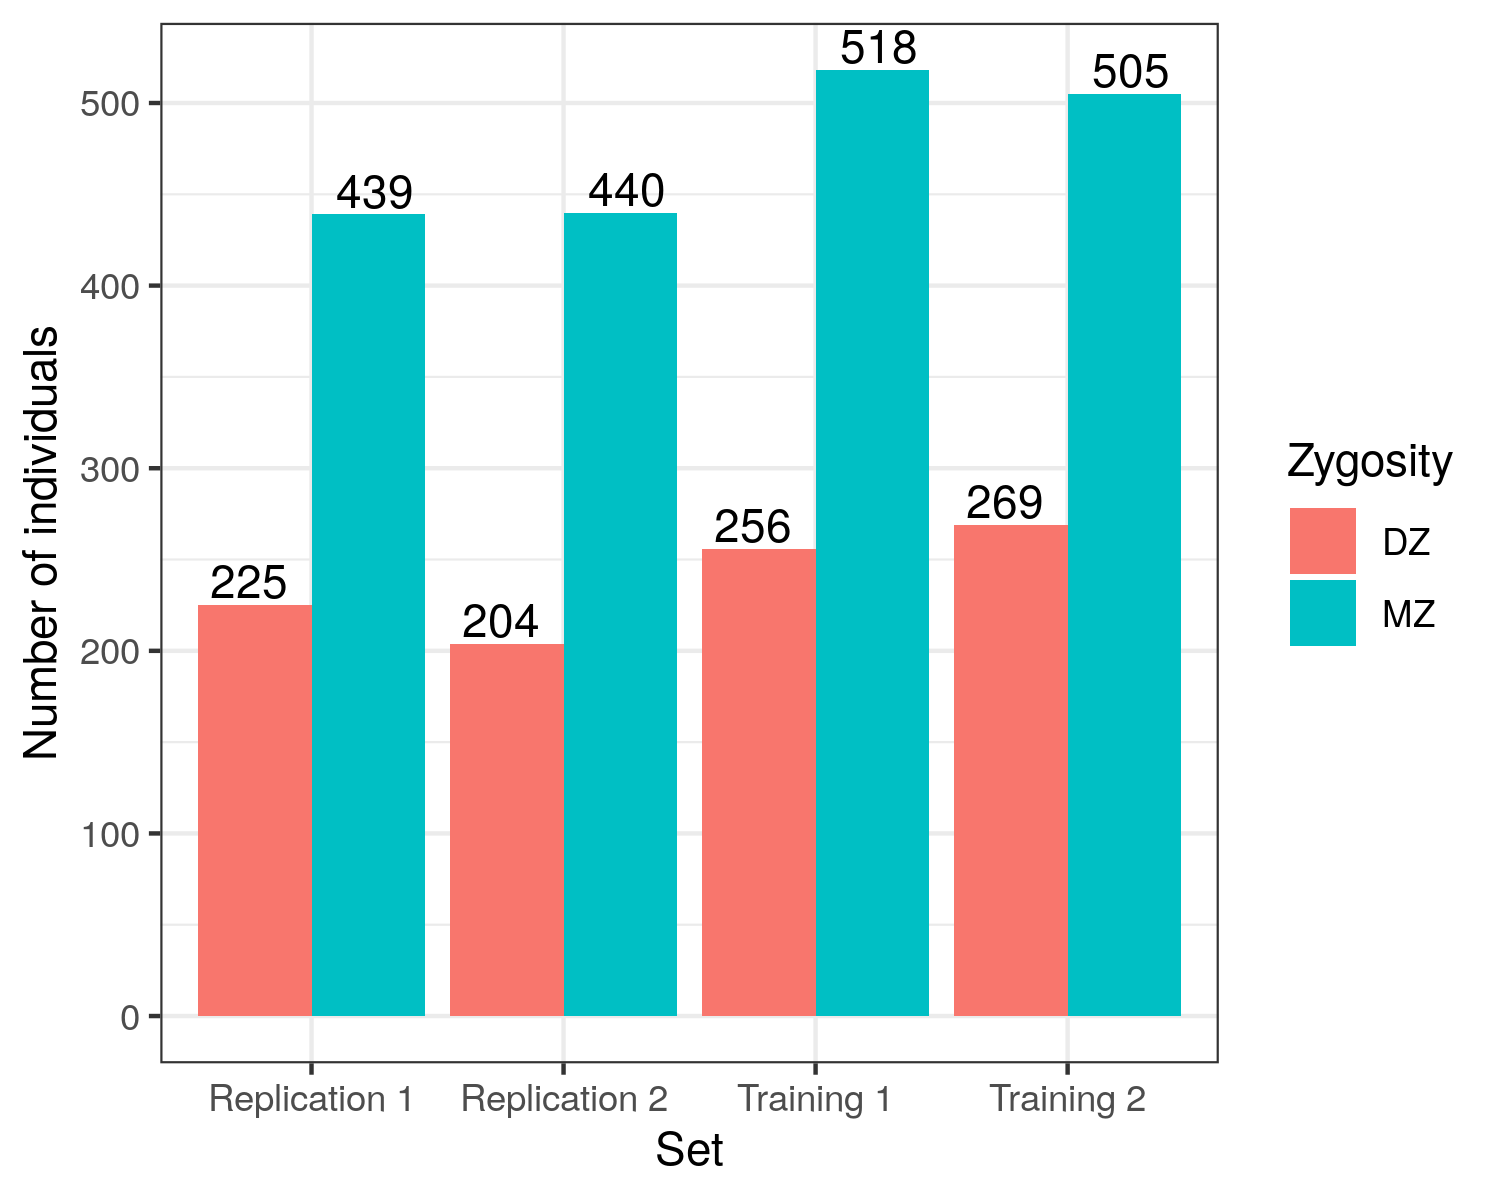
Figure 5.8: Zygosity Make-up of sets Replication 1 (n = 664, 225 DZ, 439 MZ); Replication 2 (n = 644, 204 DZ, 440 MZ), Training 1 (n = 774, 256 DZ, 518 MZ); Training 2 (n = 774, 269 DZ, 505 MZ).
A variety of different initial filtering criteria were applied to the Alu elements included in the models, as well as a number of data transformations. Pre-filtering steps were performed partially for quality control and partially to see if subsets of the Alu space with biologically interesting differences could yield clocks of equivalent accuracy but which might capture different aspects of biological ageing related to repeat de-repression.
Preliminary analysis were carried out using RPM values, Quantile normalised RPM values, Absolute methylation value estimates from MEDIPS and Binarised DNA methylation data.
Quantile normalised RPM values yielded the best and most consistent results and were used in subsequent analyses.
Whilst Human epigenetic age is logarithmic with time across the lifespan the effects of this are more relevant at younger ages [442]. We fitted Alu Clock models on the natural logarithm of age in years this did not improve the quality of predicted to actual age values, likely due in part to the older age distribution of our data.
An Alu element length filter of at least 180bp or approximately two-thirds the length of a full length Alu element (~280bp) was imposed. This minimises the number of reads with the potential to misalign to other Alu elements, reads which, in this context, could lead to reduced accuracy of positionally specific Alu DNA methylation estimates [443].
CpG density filters were employed to prioritise regions likely to have dynamic and functionally interesting differences in DNA methylation. Filters were used for CpG densities above the genomic background of 2%, as well as for >5% the approximate threshold for CpG island shores and low methylation regions [84,85].
To limit the selection of predictive sites to those likely to have consistent directions of change across samples a clock was constructed with only windows which show nominally significant changes in both members of an MZ twin pair in a consistent direction. Linear models to predict age based on DNA methylation were fitted for 687 pairs of monozygotic (MZ) twins. Batch information and blood cell counts (eosinophils, lymphocytes, monocytes, neutrophils) were included as covariates.
To produce a model that specifically captures age as a function of the de-repression of Alu elements clocks were also constructed with only windows which exhibited nominally significant (p < 0.05) decreases in DNAm in both MZ twins. This filtering was based on the model used in selecting windows with a consistent direction of change.
An age predictor was also constructed using only AluY elements. AluY is the youngest (Figure 5.3), and most CpG dense (Figure 5.4) family of Alu elements. Having a CpG density closer to that of typically de-repressed functional elements may make such elements more readily susceptible to stable de-repression. In addition the host genome has had less time to adapt to the presence of these elements so their de-repression may be more disruptive than older elements.
5.3.5 Binarisation
In Alu age prediction model for which Binarisation was used the binarisation of DNA methylation data was achieved by a simple procedure: assigning windows in a given sample a DNA methylation value of 1 if their DNA methylation value was greater than the median RPM value for this window across samples and a 0 if it was less.
Binarisation of gene expression data yielded increased predictive accuracy in gene expression based ageing clocks [444]. The reasoning behind this approach is that the quantitation of changes in gene expression is noisy and binarising the data may reduce the noise whilst retaining the information important for age prediction. Whilst this approach discards information about the level of expression, sacrificing power, its success in transcription data indicate that it makes up for this possibly through greater consistency between samples reducing overfitting to misleading technical noise.
5.3.6 Comparisons to other clocks in TwinsUK Illumina 450k array data
Illumina Infinium DNA methylation 450k arrays ((C) Illumina) were also performed on TwinsUK participants (Methods 2.1). 574 Blood-derived DNA samples had matched MeDIP-seq data not used in the training or replication sets in the Alu clock analysis. These data were available for this analysis in a pre-processed form, Methylation ‘beta’ values subject to beta-mixture quantile normalisation (BMIQ) as previously described [209,107].
DNA methylation ages were computed for the Horvath [168], Hannum et al. [167] and Levine et al. ‘PhenoAge’ [193] clocks, using the coefficients, intercept values and transformations specified the original publications, and a model of the form: \(DNAmAge = a\beta_{probe\ 1} ... b\beta_{probe\ n} + intercept\) Where a, b and intercept are model parameters provided by the authors of the respective DNAm age predictors. In the absence of an intercept value 0 was used, in the case of the Hannum clock. All age acceleration values were computed as the predicted age minus the chronological age, including for the Alu age predictors.
5.3.7 Genome Wide Association studies of Alu Age Acceleration
In collaboration with Pirro Hysi at King’s College London Genome wide association studies (GWAS) were performed for Alu age acceleration. Genotypic and phenotypeic data from the TwinsUK adult twin registry (see methods 2), with 1108 individuals being analysed in the GWAS. Genotype data was generated with a combination of Illumina HumanHap300 and HumanHap610Q chips [445]. Intensity data for each of the arrays were pooled separately. Genotypes were called with the Illuminus32 calling algorithm, thresholding on a maximum posterior probability of 0.95. Pre-phasing was performed using Eagle v2.4 [446], and imputation was performed using Minimach 3.0 [447], using haplotype information from the HRC r1.1 2016 reference panel [448]. Linear mixed models were fitted to test for associations between the phenotypes and genetic variants using GEMMA v0.94 [449]. Family relatedness arising from the presence of siblings in the cohort was taken into account in constructing linear mixed models of each variant. Associations were considered suggestive at a p-value threshold of \(p < 1\times10^{-5}\) and significant at \(p < 5\times10^{-8}\).
5.4 Results
Table 5.1 summarises the details of Alu clocks trained with the various pre-filtering criteria applied to their starting sets. The correlation with the predicted age and the chronological age of samples unrelated to the individuals on which the clock was trained indicate model quality (Figure 5.9 a). The quality of the Alu clock predictions is quite poor in comparison to other DNA methylation clocks with the highest R of 0.65 and a median absolute error of 8.1 years, compared to 0.96 and 3.6 years for Horvath’s multi-tissue clock [168].
| Training Set | Prediction Set | R | R² | RMSE | MAE | Avail. Windows | Clock Windows | Avail. Alu Elems. | Clock Alu Elems. | Description | % Coef. -ve | AluJ | AluS | AluY | FAM | FLAM | FRAM | |
|---|---|---|---|---|---|---|---|---|---|---|---|---|---|---|---|---|---|---|
| A | Training 1 | Replication 1 | 0.651 | 0.424 | 10.958 | 8.112 | 2,656,388 | 6,942 | 1,056,610 | 6,513 | No Filters | 46.744 | 24.3 | 59.4 | 13 | 0.389 | 2.39 | 0.533 |
| 0.619 | 0.383 | 11.201 | 8.349 | 1,858,147 | 6,616 | 788,953 | 6,196 | >180bp, 99.9% non-zero | 47.415 | 25.4 | 59.9 | 11.9 | 0.378 | 1.96 | 0.514 | |||
| 0.609 | 0.371 | 11.165 | 8.221 | 981,452 | 6,293 | 561,509 | 5,894 |
|
47.624 | 26.1 | 58.5 | 12 | 0.493 | 2.38 | 0.556 | |||
| 0.591 | 0.349 | 11.243 | 8.360 | 1,858,147 | 2,131 | 788,953 | 2,066 |
|
46.739 | 25.5 | 59 | 12.6 | 0.235 | 2.21 | 0.516 | |||
| 0.566 | 0.321 | 11.275 | 8.010 | 6,000 | 1,269 | 5,283 | 1,040 |
|
47.518 | 21 | 60.5 | 14.7 | 0.394 | 2.76 | 0.63 | |||
| 0.524 | 0.275 | 11.542 | 8.541 | 192,299 | 4,884 | 138,506 | 4,573 |
|
48.464 | 26.4 | 57 | 12.8 | 0.389 | 2.78 | 0.696 | |||
| 0.432 | 0.186 | 12.152 | 9.006 | 4,289 | 1,187 | 3,708 | 924 |
|
56.613 | 21.3 | 59.2 | 15.2 | 0.337 | 2.95 | 0.927 | |||
| 0.292 | 0.085 | 12.879 | 9.614 | 92,473 | 1,880 | 62,731 | 1,769 |
|
51.330 | 26.1 | 57.2 | 12.4 | 0.479 | 3.09 | 0.638 | |||
| B | Training 2 | Replication 2 | 0.615 | 0.378 | 12.021 | 8.753 | 2,656,388 | 7,091 | 1,056,610 | 6,610 | No Filters | 46.002 | 25.3 | 59.2 | 12.4 | 0.268 | 2.31 | 0.522 |
| 0.582 | 0.339 | 11.828 | 8.442 | 192,299 | 5,007 | 138,506 | 4,650 |
|
48.252 | 26 | 58.5 | 12 | 0.499 | 2.52 | 0.519 | |||
| 0.576 | 0.332 | 12.332 | 8.908 | 1,858,147 | 6,435 | 788,953 | 6,021 | >180bp, 99.9% non-zero | 46.636 | 24.6 | 59.3 | 12.6 | 0.389 | 2.69 | 0.451 | |||
| 0.572 | 0.328 | 11.844 | 8.928 | 1,858,147 | 2,621 | 788,953 | 2,546 |
|
44.830 | 23.9 | 60.5 | 12.2 | 0.496 | 2.29 | 0.534 | |||
| 0.572 | 0.328 | 12.296 | 8.560 | 981,452 | 5,518 | 561,509 | 5,200 |
|
47.191 | 26 | 57.9 | 12.4 | 0.217 | 3.03 | 0.544 | |||
| 0.520 | 0.271 | 12.249 | 8.186 | 6,000 | 1,238 | 5,283 | 1,026 |
|
48.142 | 22.3 | 58.6 | 15.7 | 0.162 | 2.58 | 0.727 | |||
| 0.404 | 0.163 | 12.953 | 9.330 | 4,289 | 1,045 | 3,708 | 853 |
|
58.086 | 22.4 | 56.1 | 17.6 | 0.191 | 3.16 | 0.574 | |||
| 0.290 | 0.084 | 13.657 | 9.459 | 92,473 | 2,656 | 62,731 | 2,478 |
|
50.075 | 26 | 59.2 | 11.3 | 0.301 | 2.52 | 0.678 |
Table 5.2 shows the model summaries when correlations are computed for for the related sets comprised of the twins of individuals in the training set. The correlations are mostly slightly higher for this prediction than for the prediction of unrelated individuals (Figure 5.9 b). This suggests that there are not large genetic effects on the models as their predictive efficacy is only marginally better when employed to predict the age of individuals closely related to the training set compared to unrelated individuals.
| Training Set | Prediction Set | R | R² | RMSE | MAE | Avail. Windows | Clock Windows | Avail. Alu Elems. | Clock Alu Elems. | Description | % Coef. -ve | AluJ | AluS | AluY | FAM | FLAM | FRAM | |
|---|---|---|---|---|---|---|---|---|---|---|---|---|---|---|---|---|---|---|
| A | Training 1 | Replication 2 | 0.677 | 0.458 | 11.380 | 8.191 | 2,656,388 | 6,311 | 1,056,610 | 5,930 | No Filters | 46.427 | 24.7 | 59.8 | 12.3 | 0.38 | 2.33 | 0.475 |
| 0.644 | 0.415 | 11.626 | 8.388 | 1,858,147 | 6,327 | 788,953 | 5,948 | >180bp, 99.9% non-zero | 47.432 | 25.1 | 60.2 | 11.6 | 0.253 | 2.29 | 0.616 | |||
| 0.631 | 0.398 | 11.600 | 8.240 | 981,452 | 6,610 | 561,509 | 6,215 |
|
47.428 | 26.3 | 58.7 | 11.8 | 0.424 | 2.34 | 0.454 | |||
| 0.600 | 0.360 | 11.593 | 7.908 | 192,299 | 5,052 | 138,506 | 4,707 |
|
48.733 | 25.9 | 57.6 | 12.5 | 0.337 | 2.99 | 0.673 | |||
| 0.575 | 0.330 | 11.854 | 8.313 | 6,000 | 1,208 | 5,283 | 1,005 |
|
48.427 | 20.9 | 61.3 | 14.4 | 0.248 | 2.73 | 0.331 | |||
| 0.569 | 0.324 | 11.710 | 8.531 | 1,858,147 | 2,401 | 788,953 | 2,334 |
|
46.397 | 24.5 | 59.8 | 12.3 | 0.25 | 2.54 | 0.583 | |||
| 0.492 | 0.242 | 12.359 | 9.165 | 4,289 | 1,297 | 3,708 | 1,002 |
|
54.819 | 21.7 | 59.8 | 14.9 | 0.463 | 2.47 | 0.694 | |||
| 0.302 | 0.091 | 13.450 | 9.342 | 92,473 | 1,951 | 62,731 | 1,839 |
|
51.205 | 25.1 | 59 | 11.8 | 0.564 | 2.97 | 0.615 | |||
| B | Training 2 | Replication 1 | 0.634 | 0.402 | 11.171 | 8.047 | 2,656,388 | 6,857 | 1,056,610 | 6,406 | No Filters | 45.909 | 25.3 | 59.6 | 12 | 0.335 | 2.06 | 0.613 |
| 0.586 | 0.343 | 11.245 | 8.216 | 1,858,147 | 2,052 | 788,953 | 1,986 |
|
43.275 | 23.6 | 61.6 | 12 | 0.439 | 1.8 | 0.439 | |||
| 0.582 | 0.339 | 11.591 | 8.631 | 981,452 | 5,226 | 561,509 | 4,893 |
|
47.608 | 25.9 | 57.7 | 12.3 | 0.402 | 3.12 | 0.574 | |||
| 0.573 | 0.328 | 11.624 | 8.658 | 1,858,147 | 5,907 | 788,953 | 5,545 | >180bp, 99.9% non-zero | 46.843 | 25.3 | 58.2 | 13 | 0.423 | 2.57 | 0.542 | |||
| 0.568 | 0.323 | 11.242 | 8.038 | 192,299 | 4,821 | 138,506 | 4,449 |
|
47.832 | 26.1 | 57.7 | 12.6 | 0.436 | 2.47 | 0.622 | |||
| 0.513 | 0.263 | 11.675 | 8.438 | 6,000 | 933 | 5,283 | 815 |
|
48.553 | 22.3 | 59.1 | 15.3 | 0.322 | 2.14 | 0.857 | |||
| 0.398 | 0.159 | 12.437 | 8.769 | 92,473 | 3,158 | 62,731 | 2,947 |
|
48.892 | 26.2 | 59.8 | 10.3 | 0.538 | 2.47 | 0.665 | |||
| 0.329 | 0.108 | 12.619 | 8.752 | 4,289 | 752 | 3,708 | 641 |
|
61.037 | 23.1 | 54 | 18.9 | 0.266 | 2.93 | 0.798 |
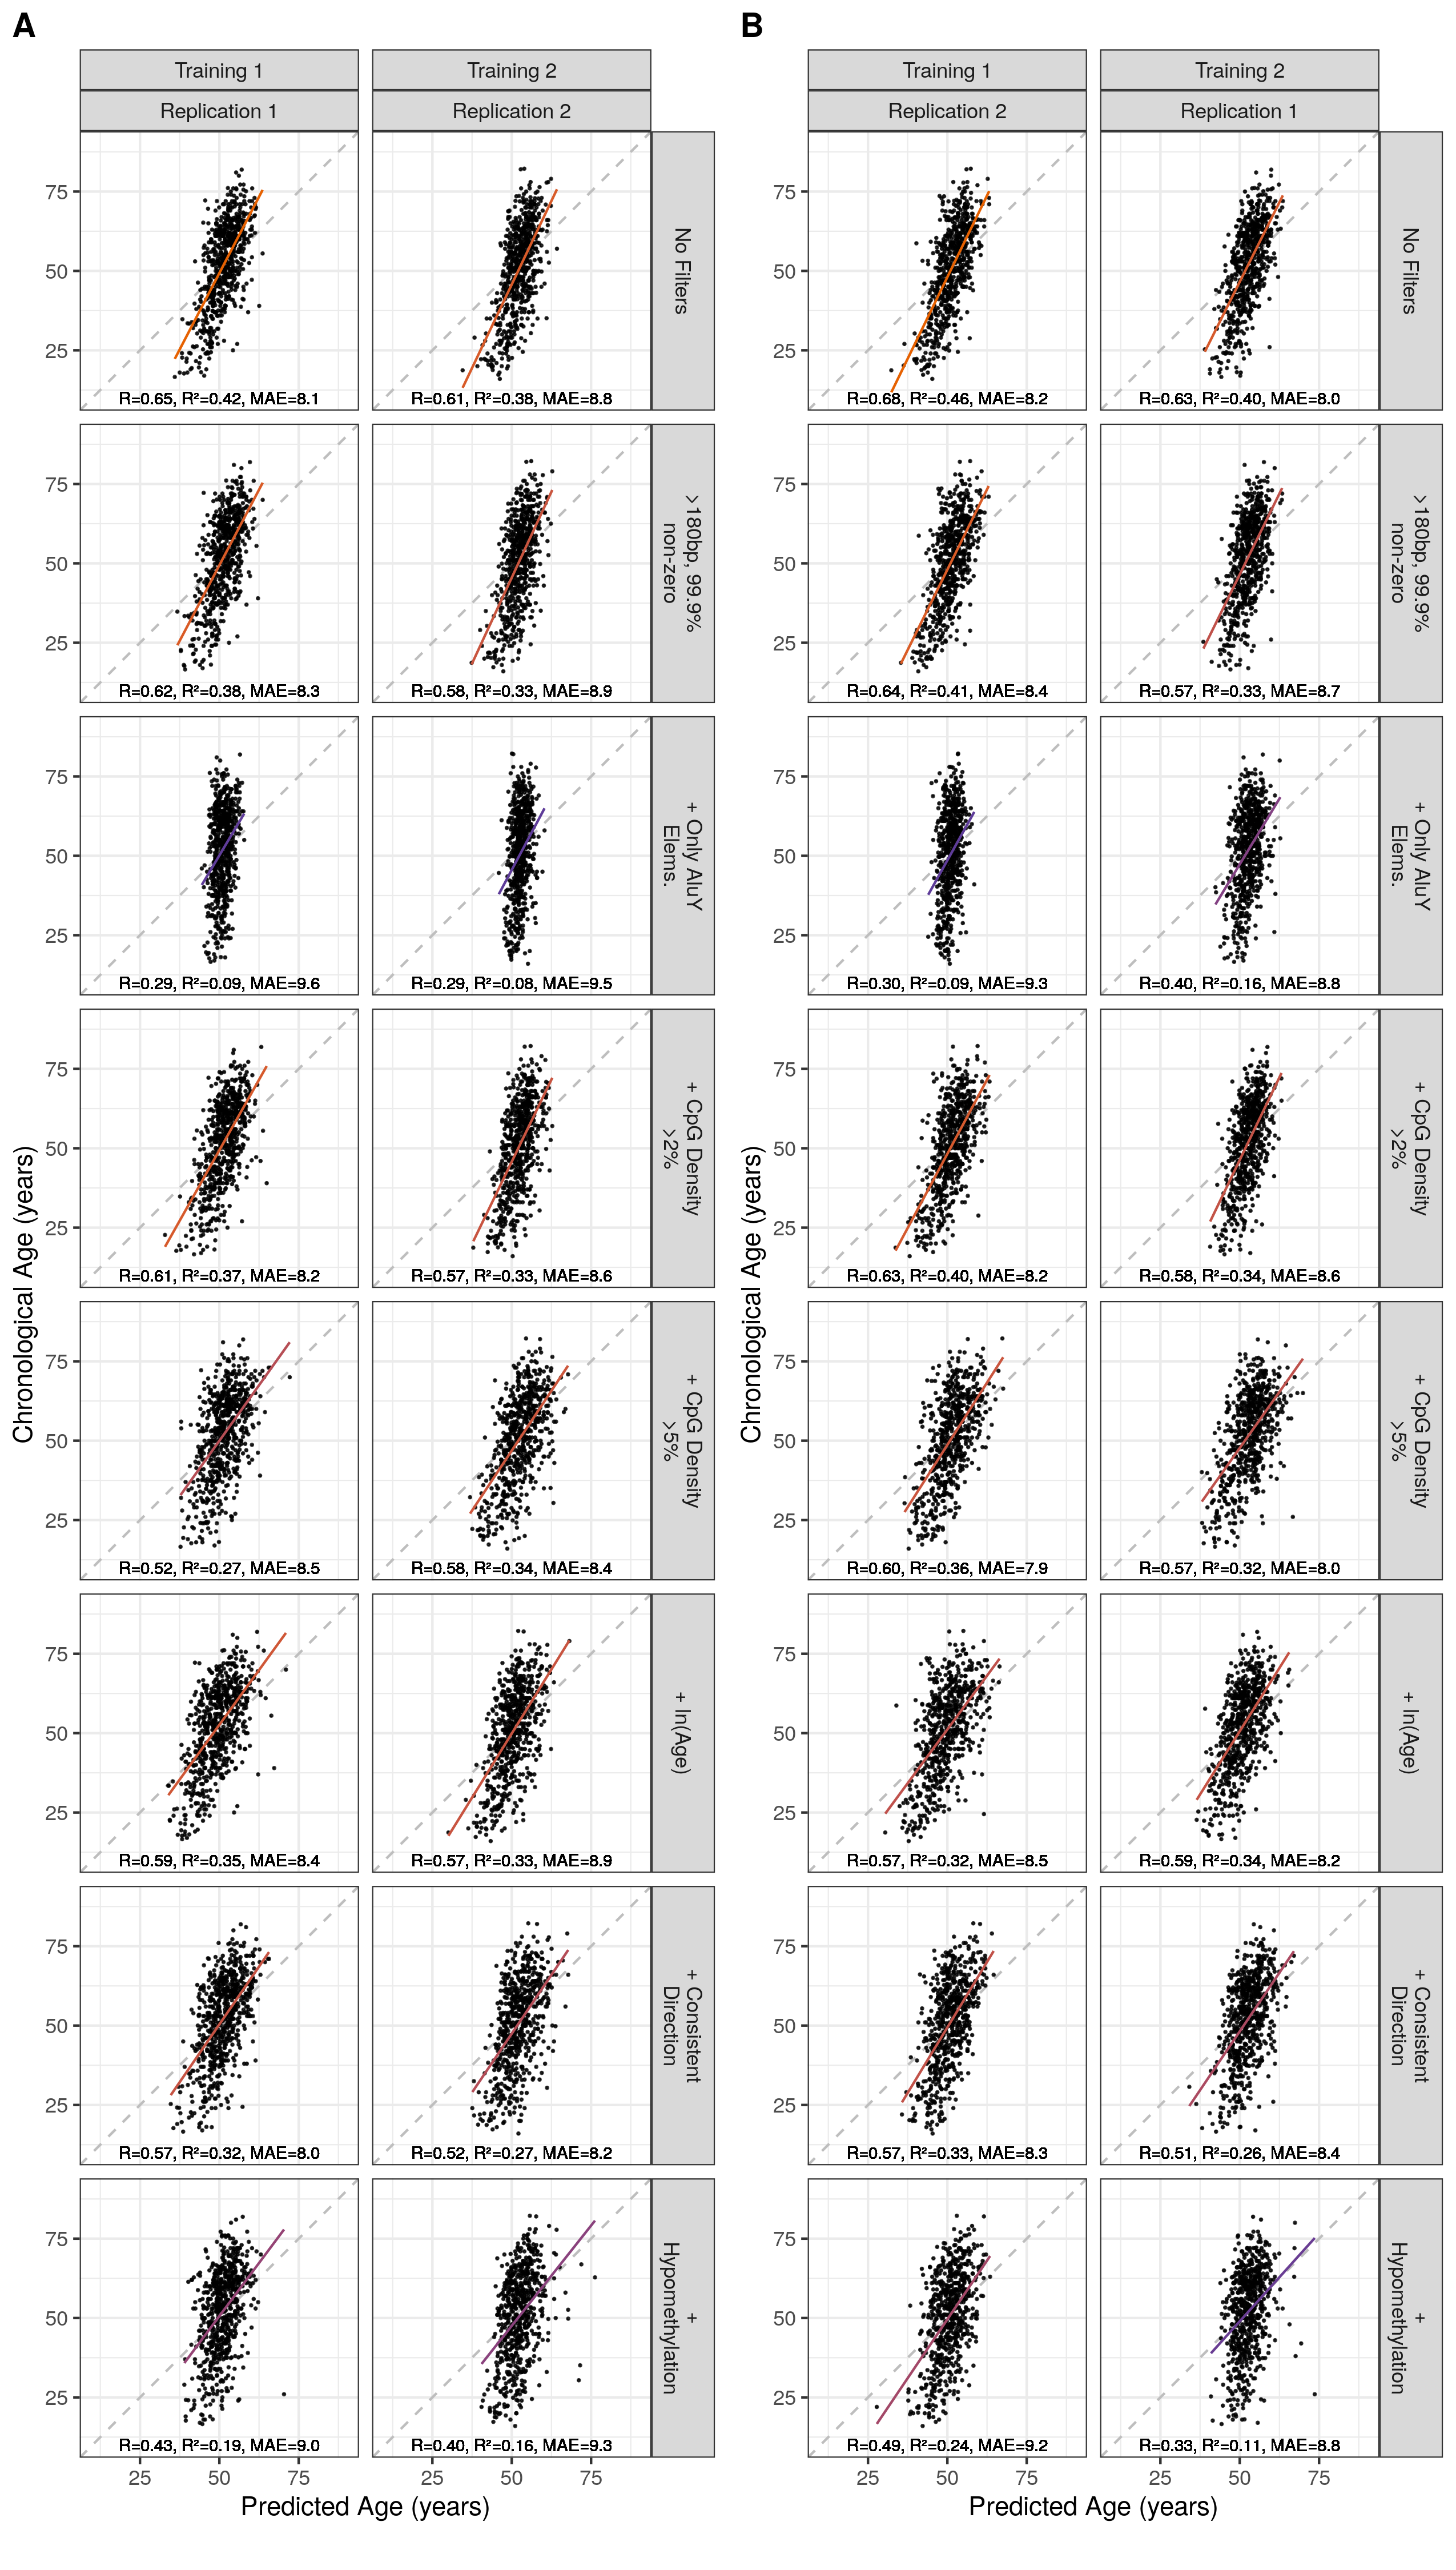
Figure 5.9: Correlation of Predicted with Chronological Age Across Models MAE = median absolute error. Orange = High \(R^2\), purple = low \(R^2\). ‘+’ signifies this filter is in addition to element length >180bp and 99.9% non-zero RPM values at this locus.
5.4.1 Comparison to other DNA methylation clocks
To compare the Alu clock results with those of other DNA methylation age clocks DNAm age was predicted for the: Horvath [168], Hannum et al. [167] and Levine et al. ‘PhenoAge’ [193] clocks (Methods 5.3.6) using samples for which both DNA methylation array data and MeDIP-seq data was available (n = 574). The array based clocks all perform similarly with R values in excess of 0.8, the Alu clock only attains an R of 0.46, though with a narrower error than PhenoAge. This however, is not entirely surprising given that PhenoAge aims to capture ageing phenotypes and not narrowly chronological age.
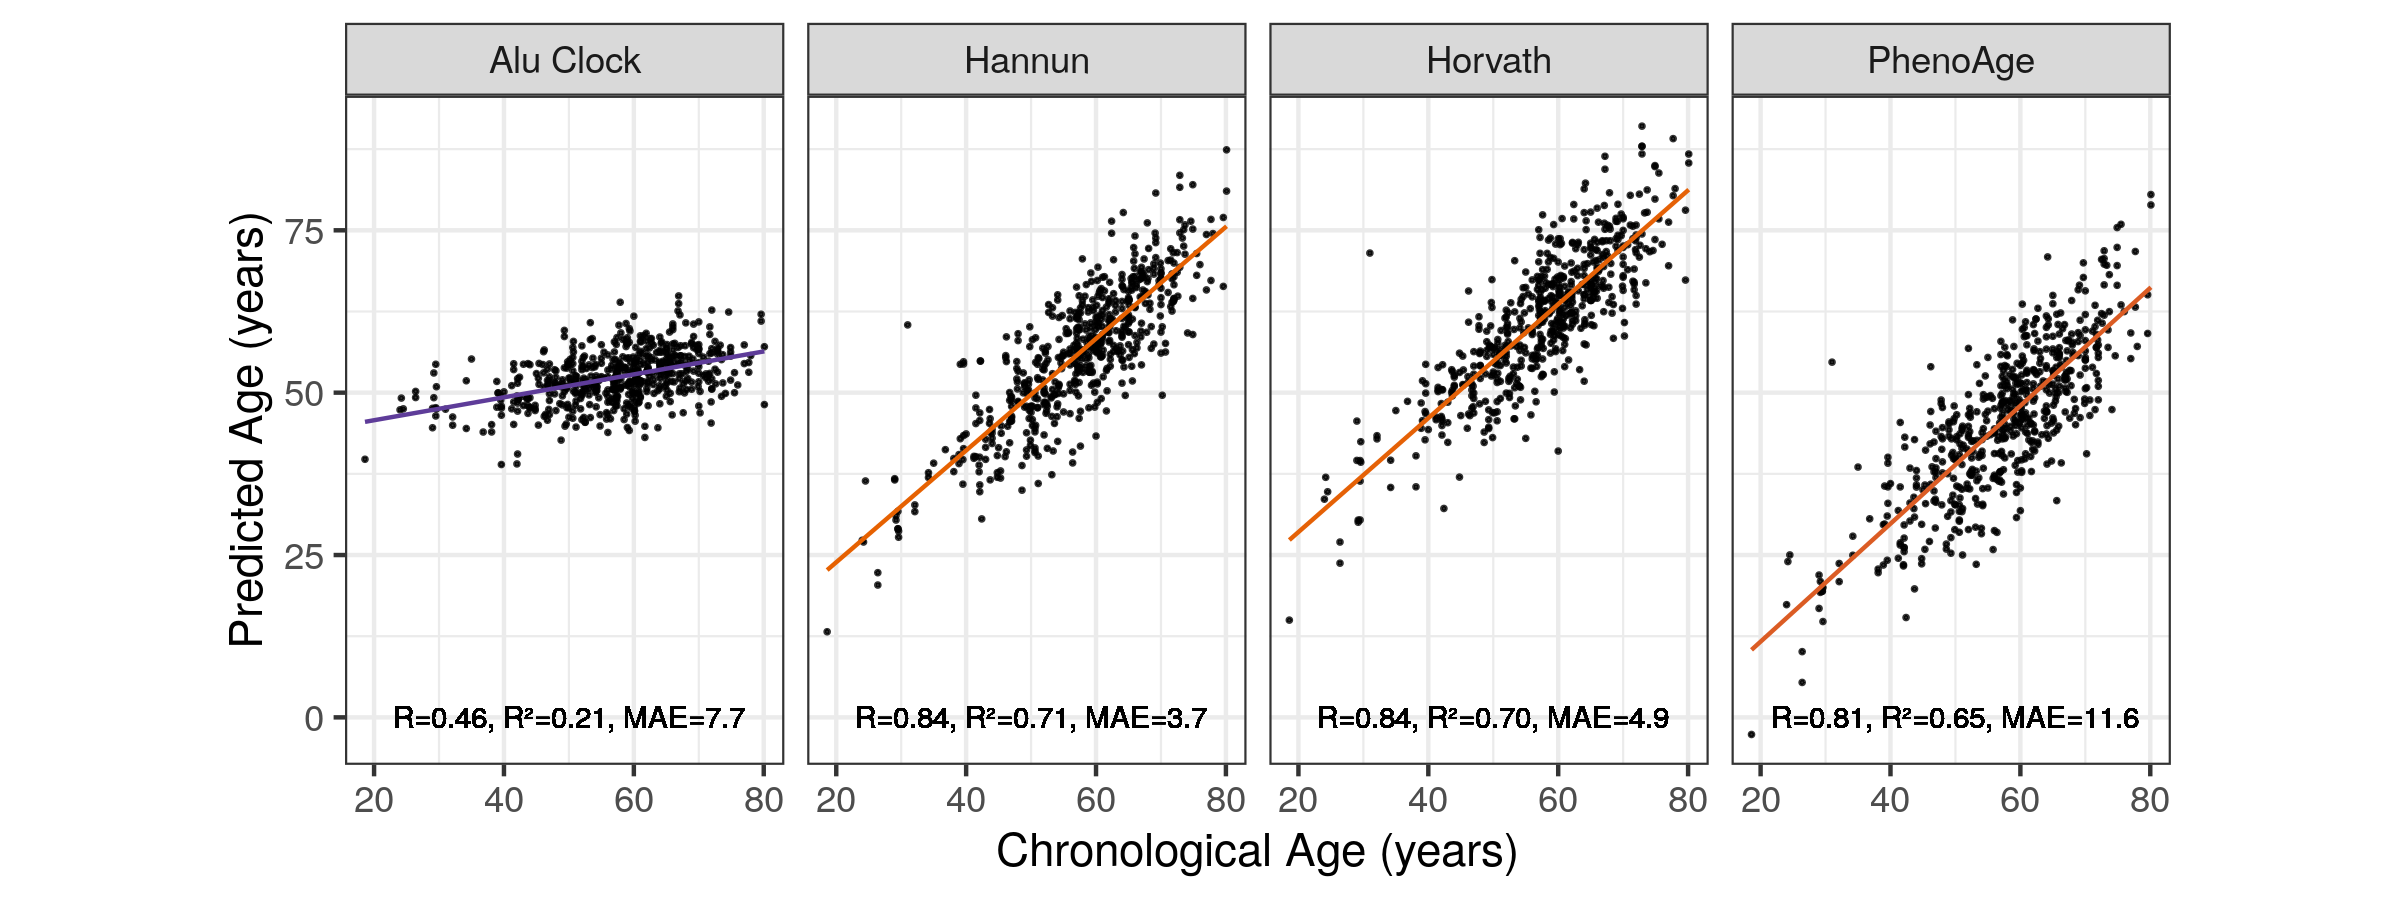
Figure 5.10: Correlation of Alu Age Acceleration with Chronological Age Across Models MAE = median absolute error. Orange = High \(R^2\), purple = low \(R^2\). Alu Clock here refers to the unfiltered model trained on the Training 1 set.
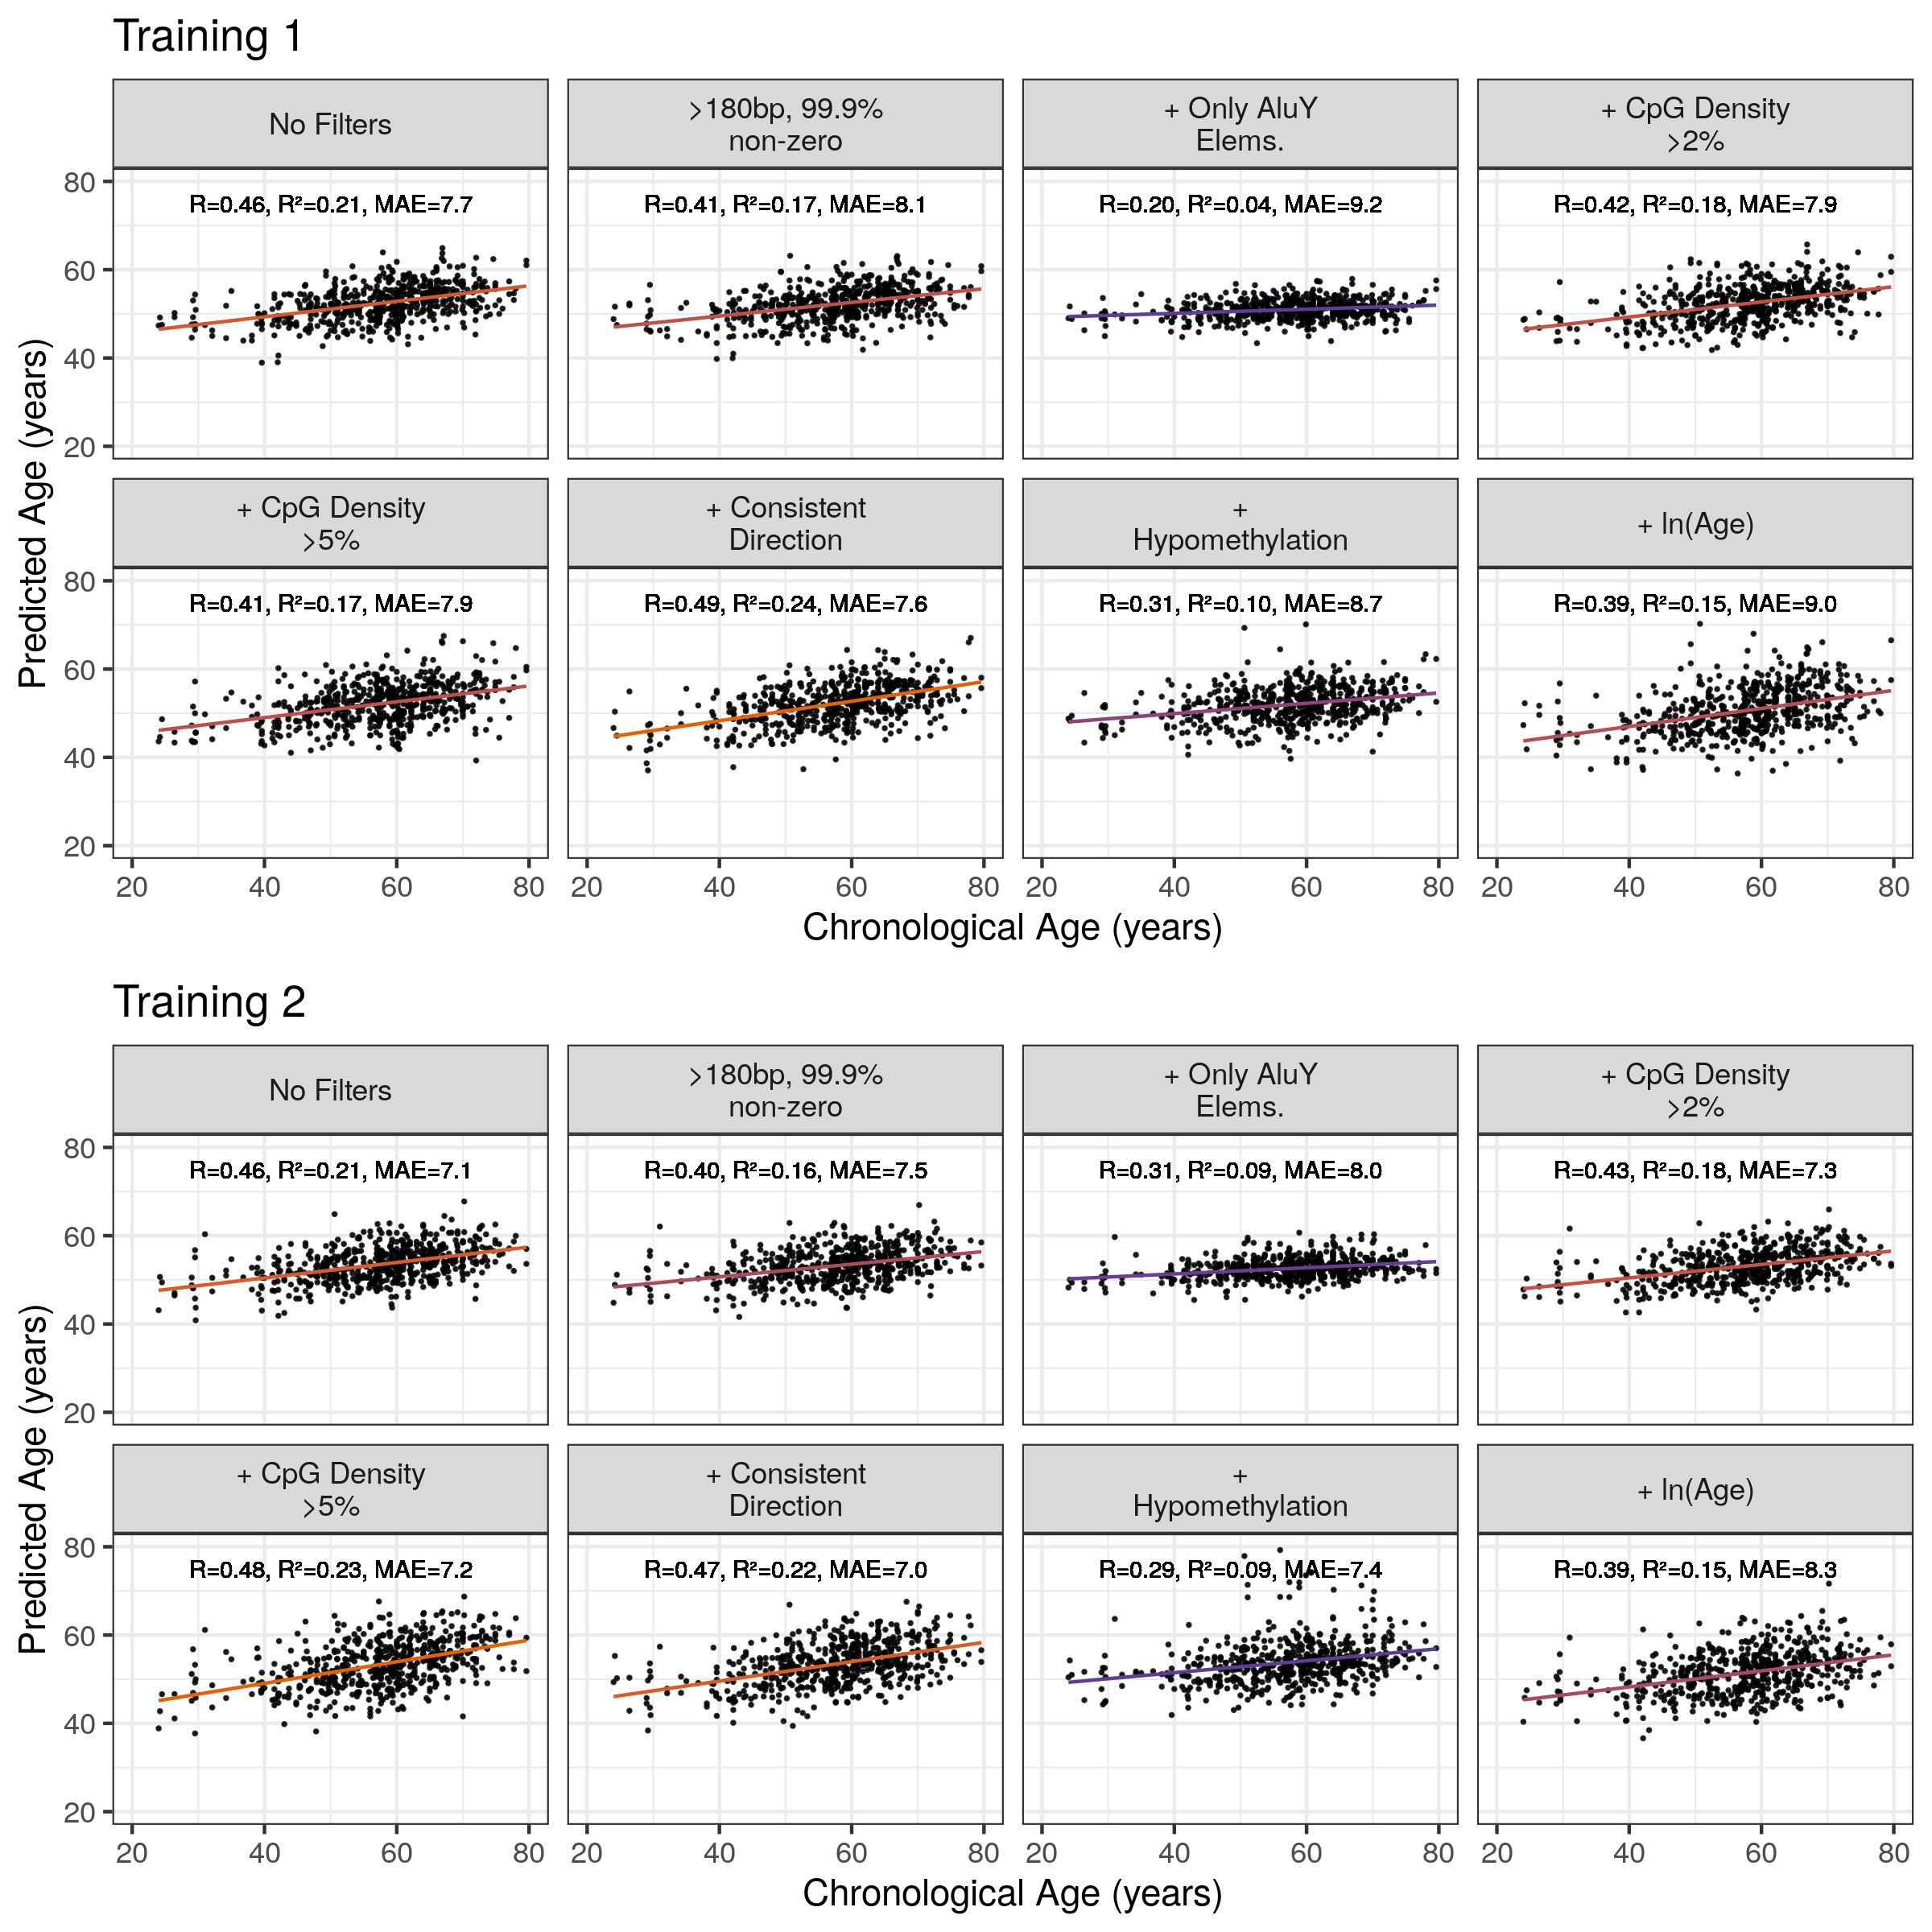
Figure 5.11: Correlation of Alu Age Acceleration with Chronological Age Across Models MAE = median absolute error. Orange = High \(R^2\), purple = low \(R^2\). Alu Clock here refers to the unfiltered model trained on the Training 1 set.
5.4.2 Alu Age Acceleration
The age acceleration values (Chronological - Predicted Age) for the Alu clocks are strongly correlated with chronological age (Figure 5.12), unlike the age acceleration of the Horvath DNA methylation clock and others (Figure 5.13). The older the individual the more prone their age is to be overestimated and vice versa. This means that Alu clock age acceleration values cannot be used independently of chronological age to make statements about biological age.
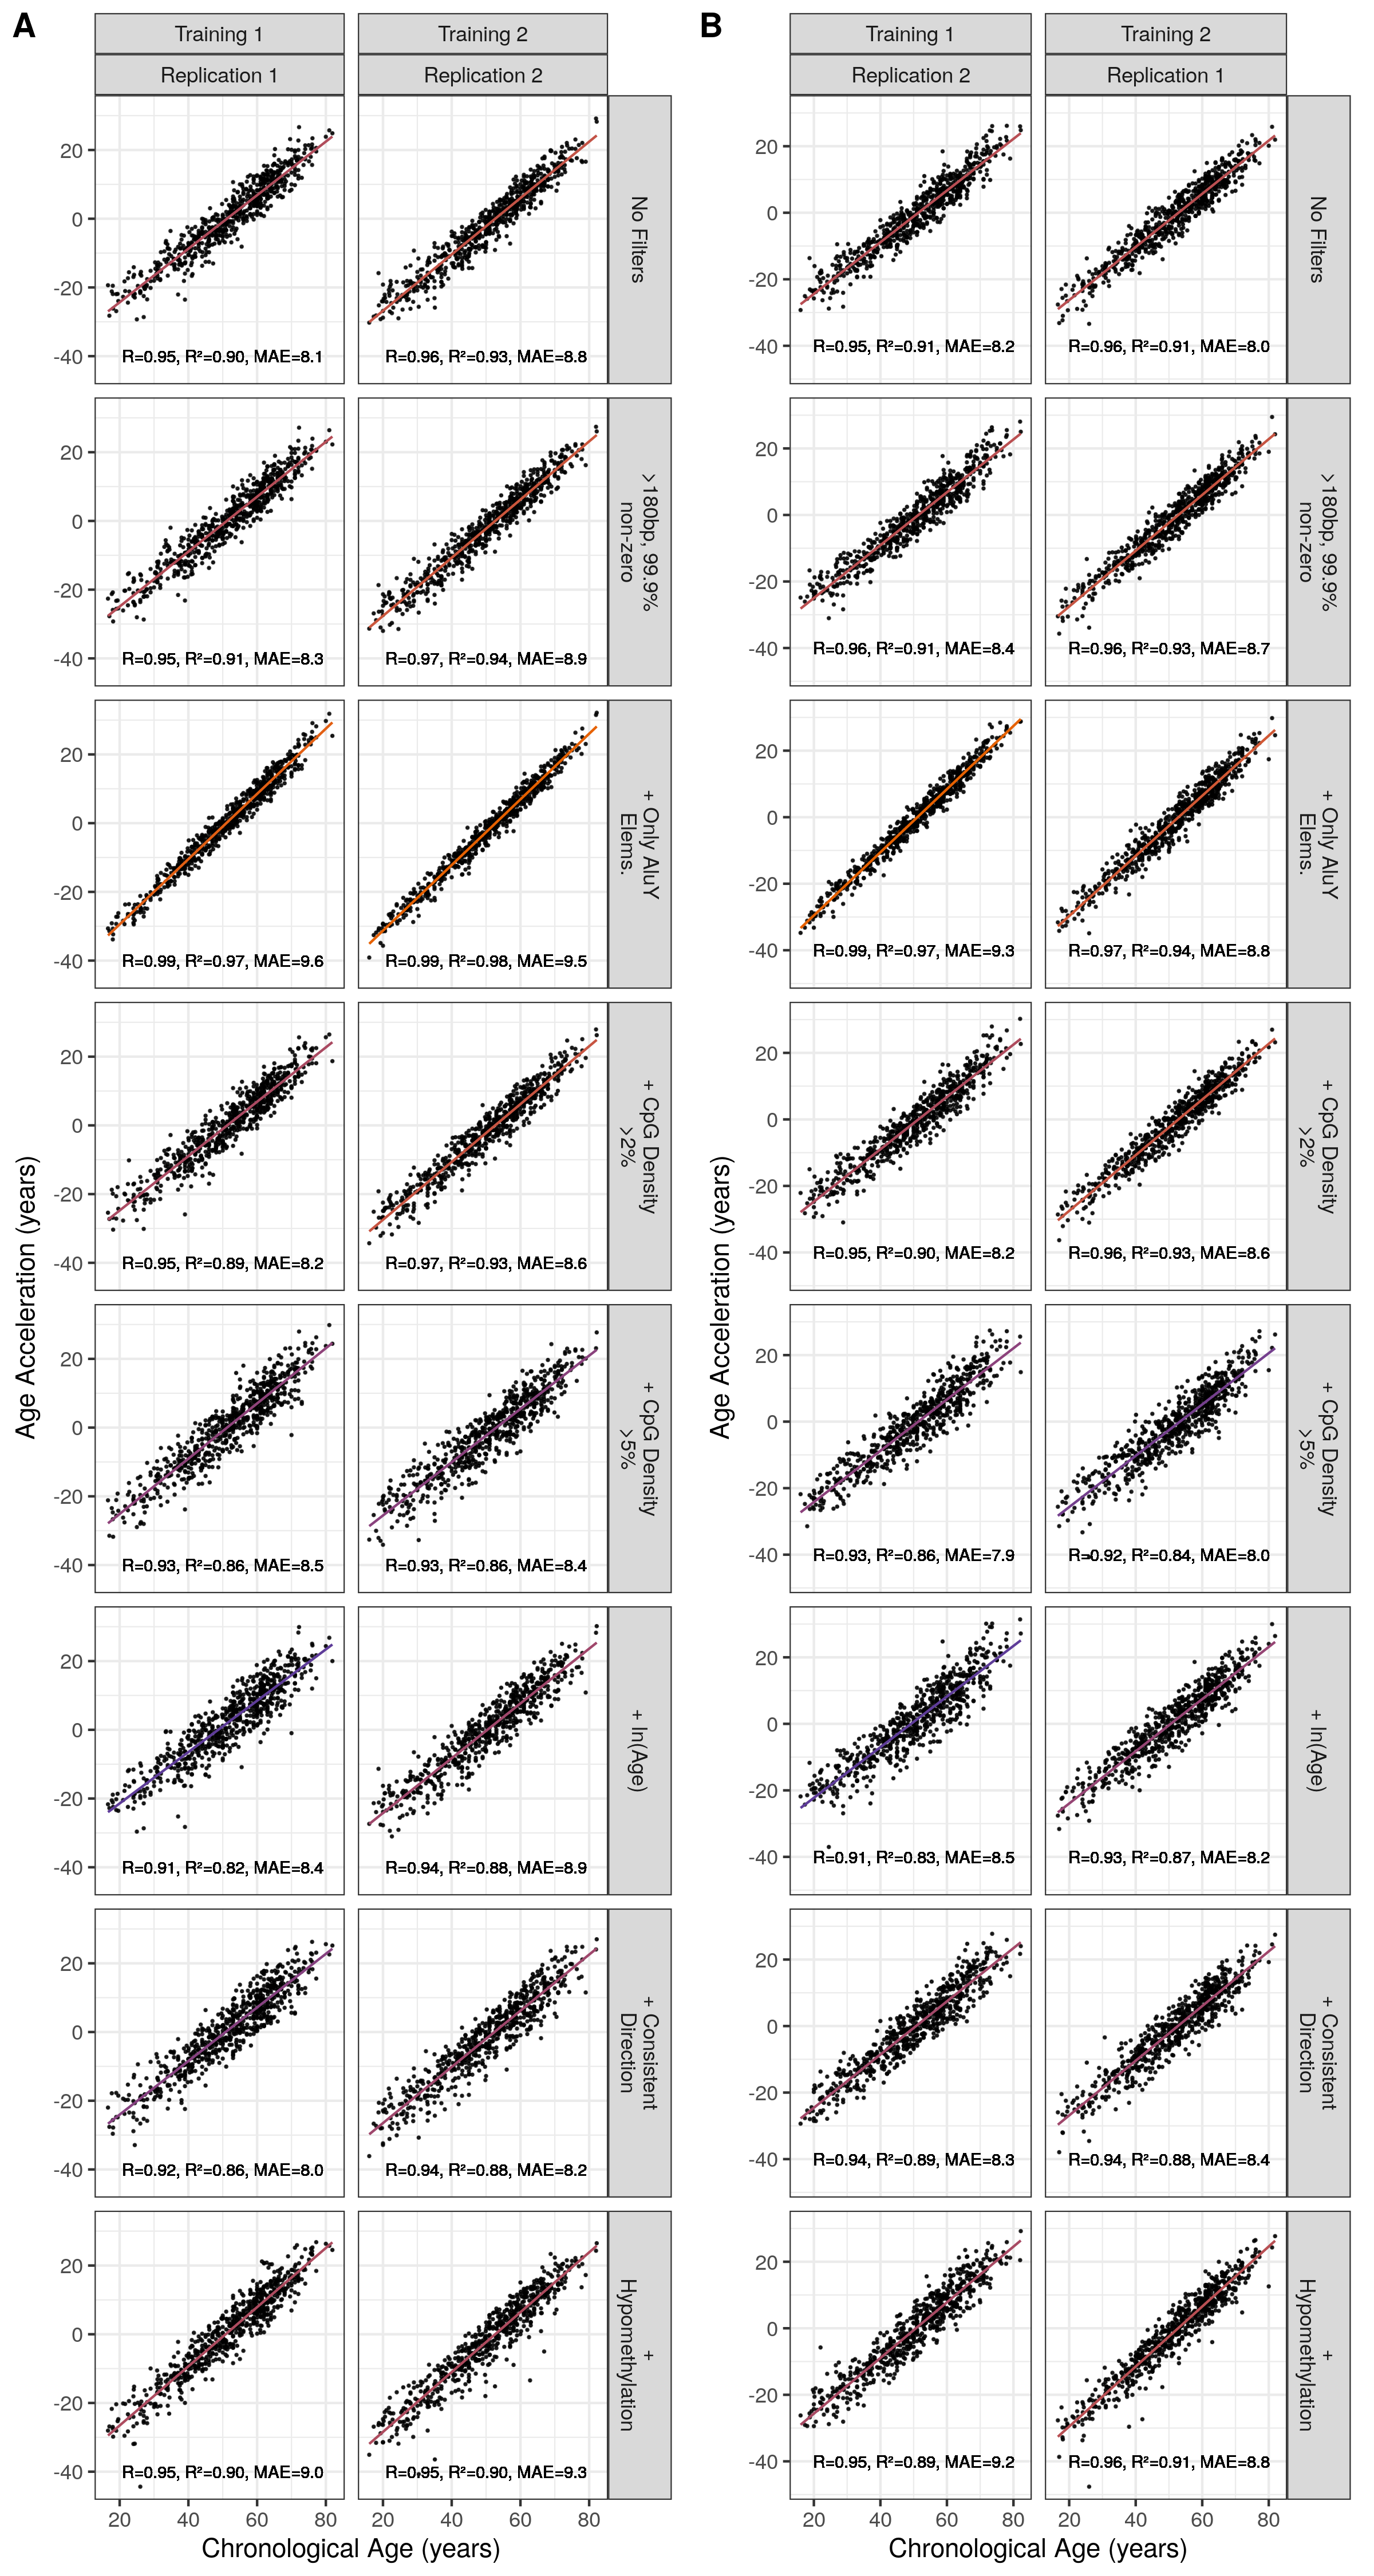
Figure 5.12: Correlation of Alu Age Acceleration with Chronological Age Across Models MAE = median absolute error. Orange = High \(R^2\), purple = low \(R^2\). ‘+’ signifies this filter is in addition to element length >180bp and 99.9% non-zero RPM values at this locus.
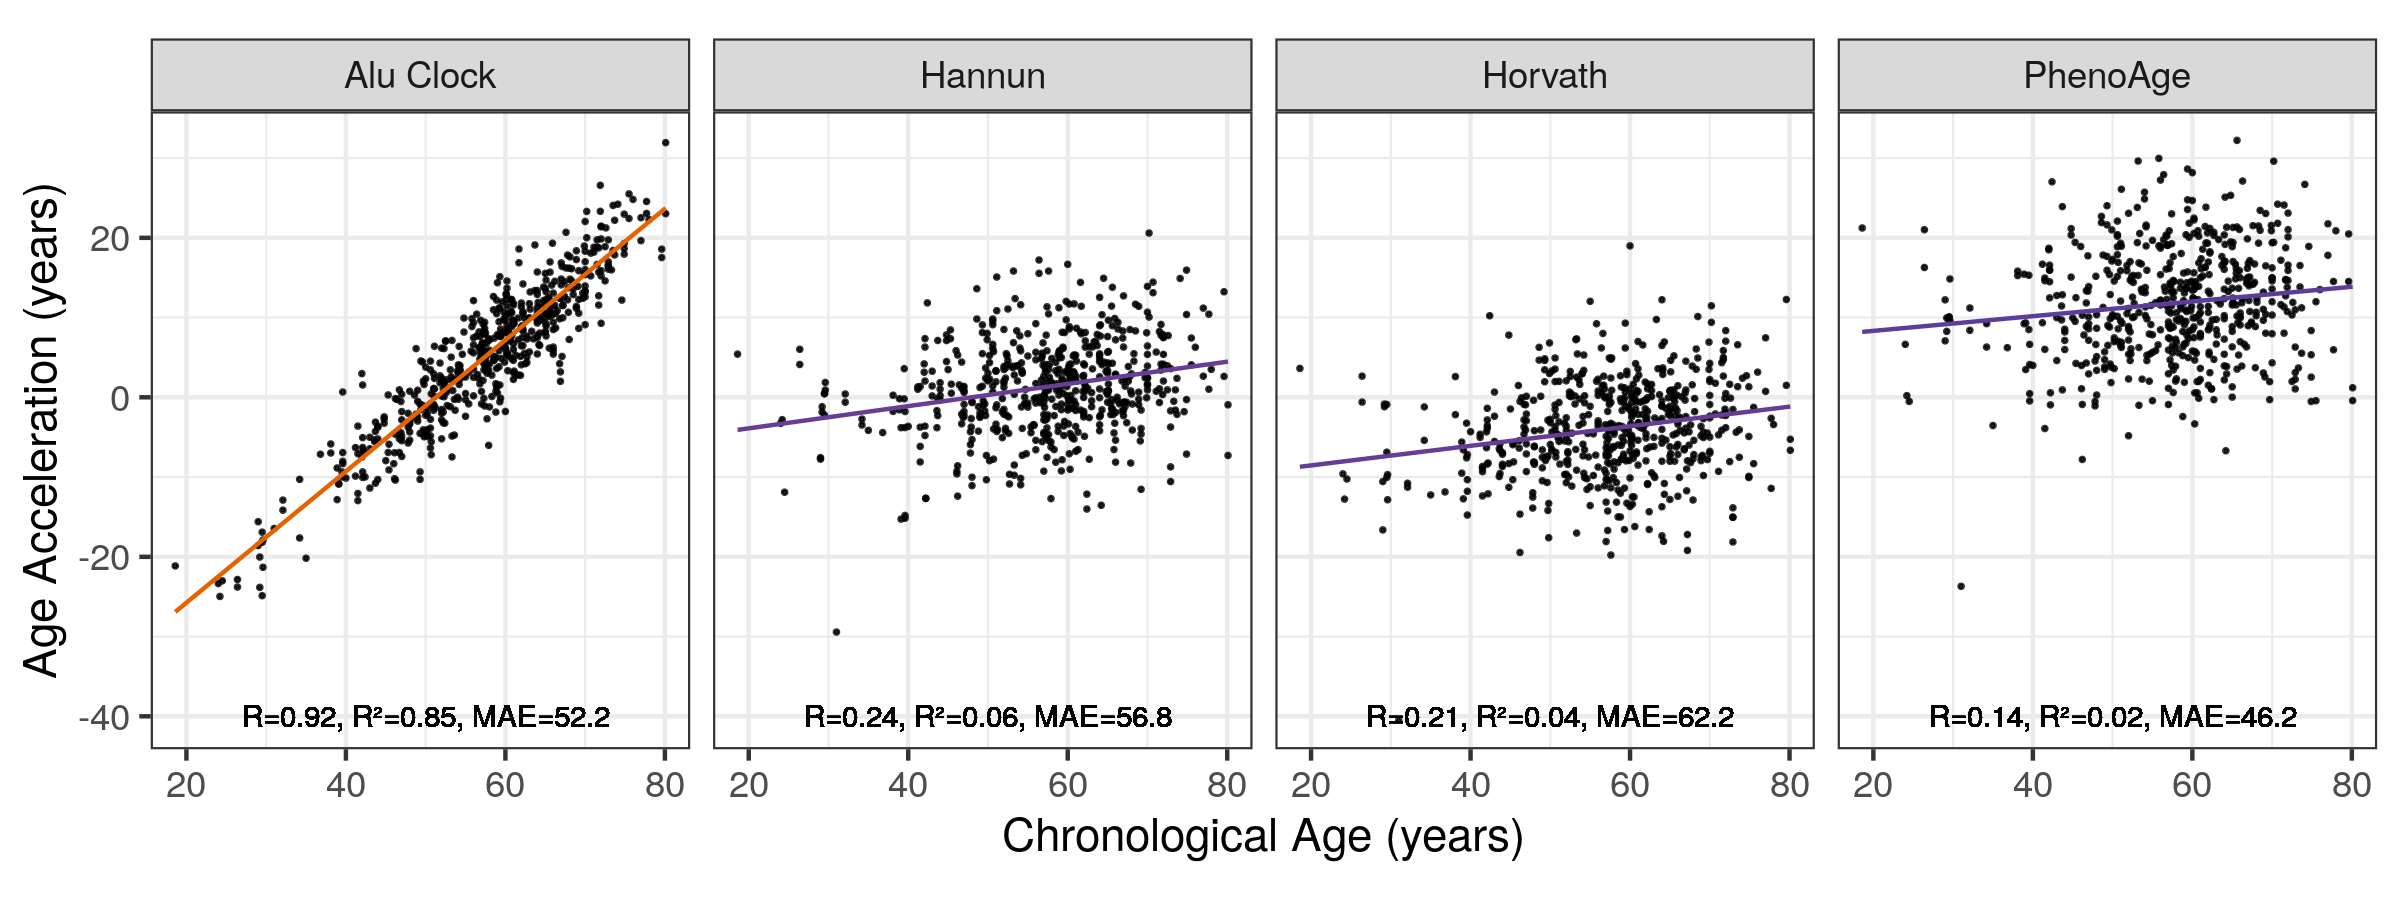
Figure 5.13: Correlation of Age Acceleration with Chronological Age Across Models MAE = median absolute error. Orange = High \(R^2\), purple = low \(R^2\). Alu Clock here refers to the unfiltered model trained on the Training 1 set. ‘+’ signifies this filter is in addition to element length >180bp and 99.9% non-zero RPM values at this locus.
Age acceleration in the Alu clocks is not strongly correlated with age acceleration in the Horvath, Hannun or PhenoAge clocks.
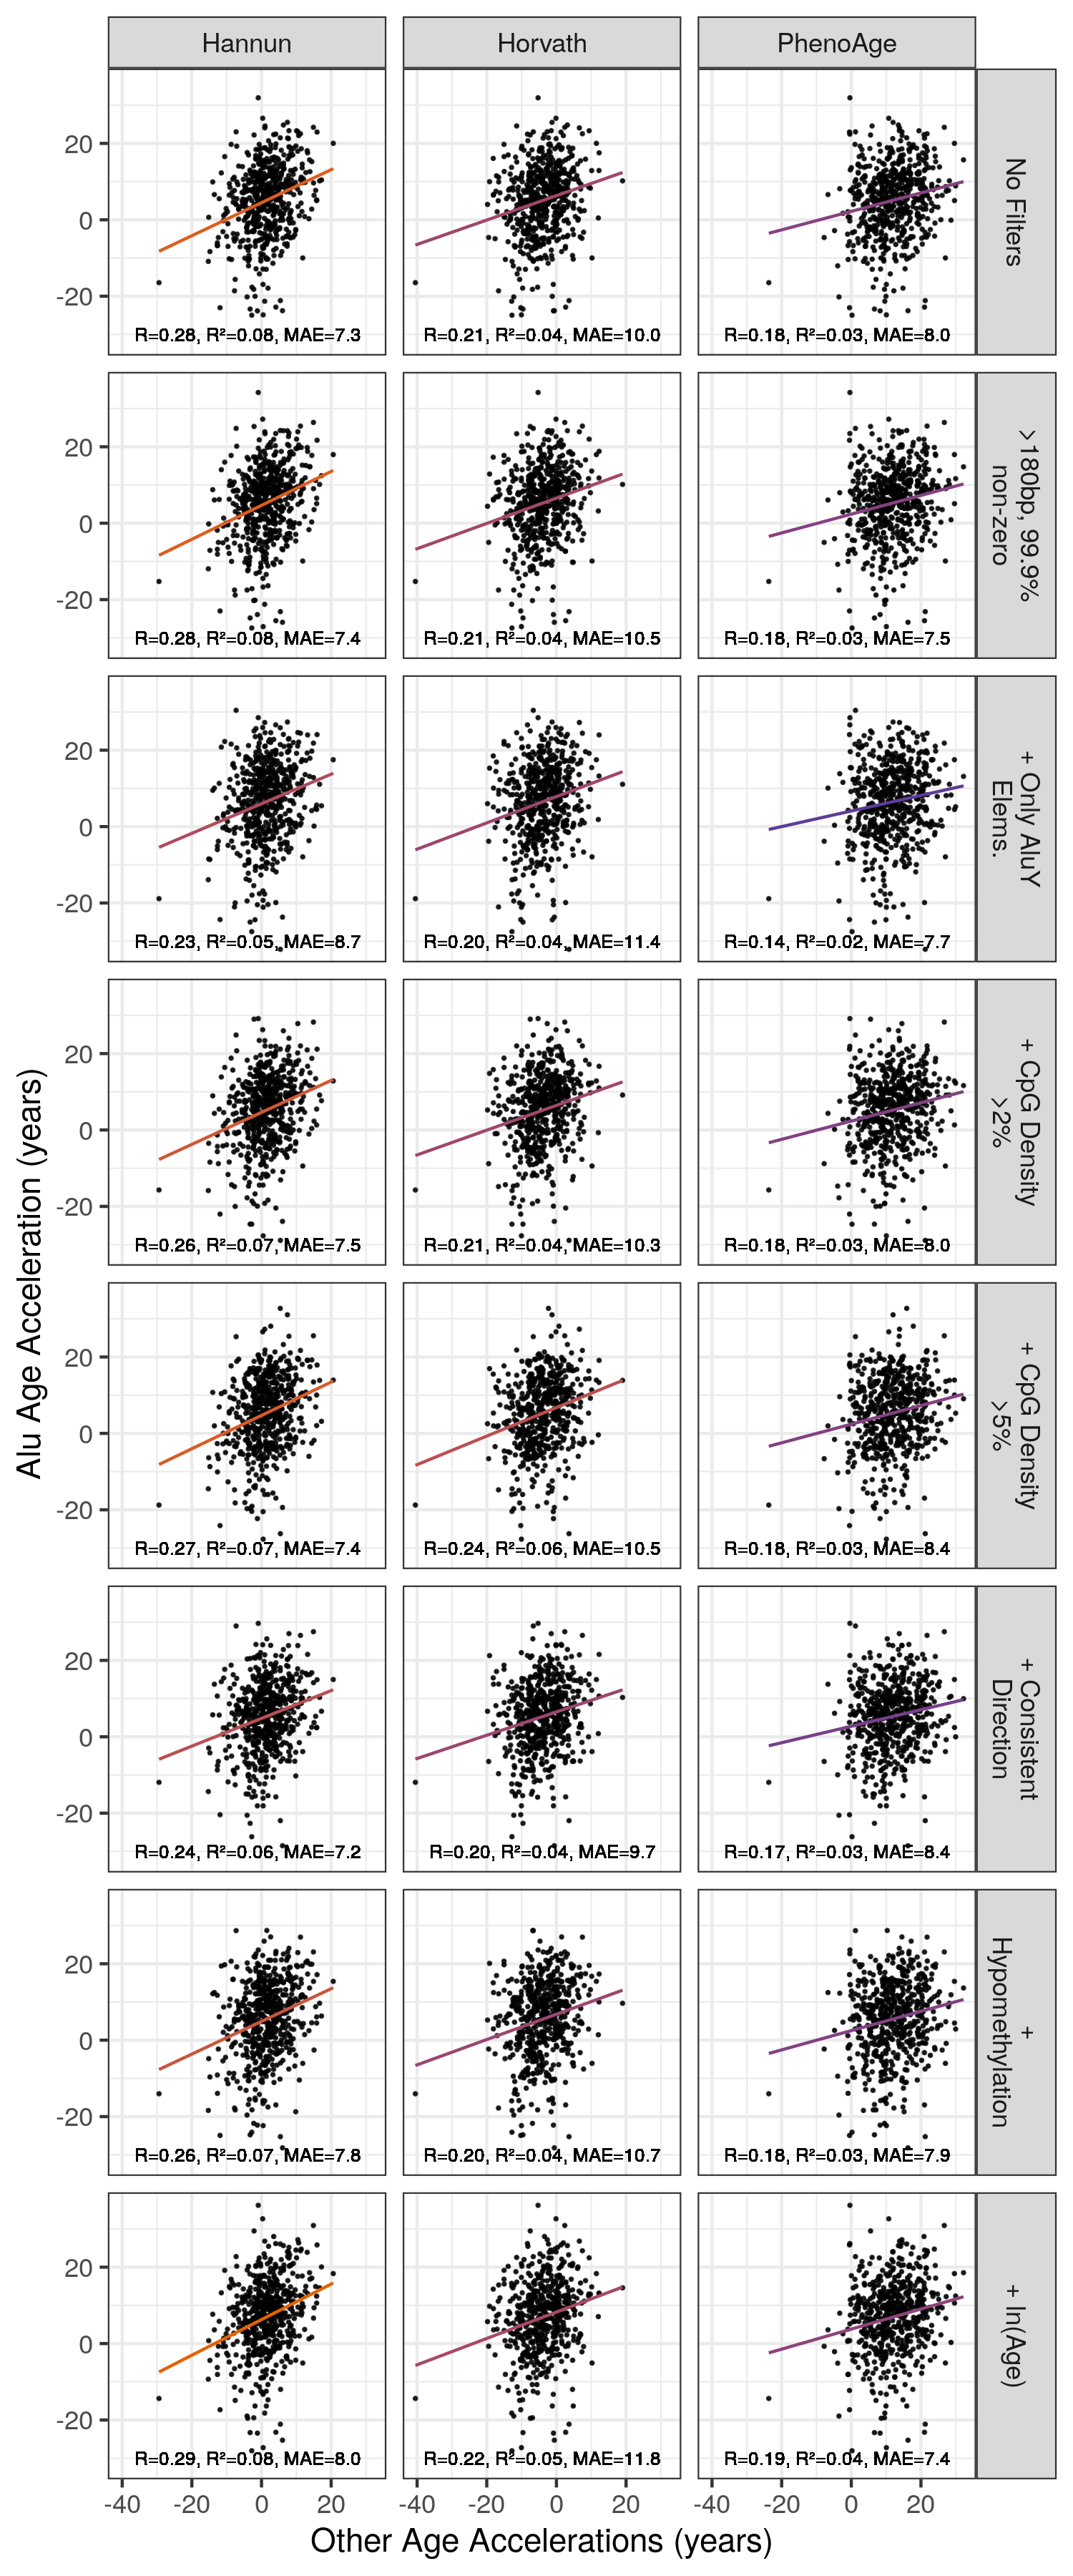
Figure 5.14: Correlation of Alu Age Accelerations with Age Acceleration from Other Models MAE = median absolute error. Orange = High \(R^2\), purple = low \(R^2\). Alu Clock here refers to the unfiltered model trained on the Training 1 set. ‘+’ signifies this filter is in addition to element length >180bp and 99.9% non-zero RPM values at this locus.
5.4.3 Top results Genome Wide Association studies of Alu Age Acceleration are shared by Alu Age predictors
Genome wide association studies (GWAS) for Alu age acceleration using acceleration metrics from two models were performed. The models used were the unfiltered (model 1) and the element length and percent zero filtered (model 2) models trained on training set 1. The Manhattan plots in Figures 5.15 & 5.16 illustrate that GWAS for these two models have similar results with the GWAS for model 2 attaining some lower p-values than model 1.
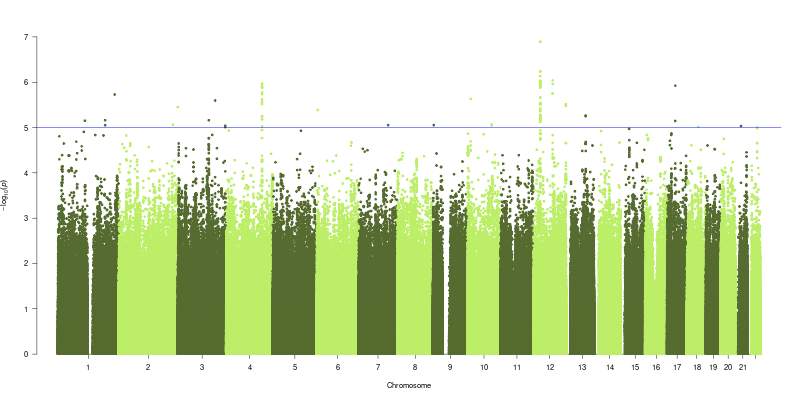
Figure 5.15: Manhattan plot showing the results of a GWAS for Alu Age acceleration computed with the predictor trained using Training set 1 on unfiltered windows.
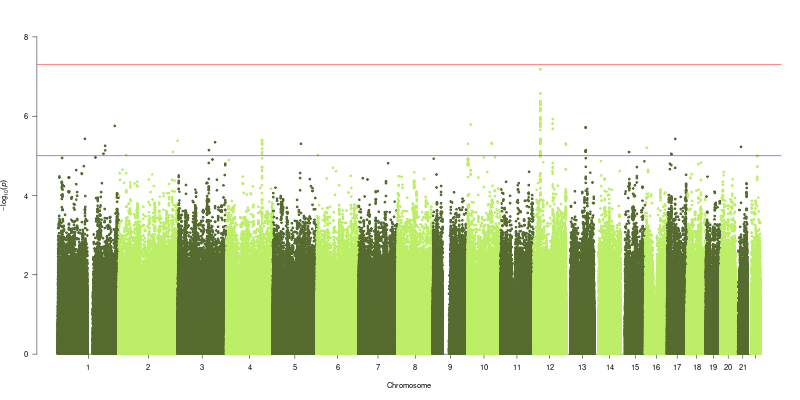
Figure 5.16: Manhattan plot showing the results of a GWAS for Alu Age acceleration computed with the predictor trained using Training set 1 on windows filtered to have an element length >180bp and 99.9% non-zero RPM values at each locus.
Neither model had any associations with a genome wide significant p-value of \(p < 5\times10^{-8}\), model 1 had 115 and model 2 130 SNPs below the suggestive threshold of \(p < 1\times10^{-5}\). These sites are listed in appendix 6.14 with the top 10 sites from each GWAS shown in Figures 5.3 & 5.4 respectively. There is substantial overlap between the 2 sets with 143 unique SNPs in the combined list.
##
## ── Column specification ────────────────────────────────────────────────────────
## cols(
##   chr = col_double(),
##   end = col_double(),
##   n_miss = col_double(),
##   alt = col_character(),
##   ref = col_character(),
##   af = col_double(),
##   beta = col_double(),
##   se = col_double(),
##   p_score = col_double(),
##   start = col_double(),
##   rsid = col_character(),
##   vcfstr = col_character()
## )
##
##
## ── Column specification ────────────────────────────────────────────────────────
## cols(
##   chr = col_double(),
##   end = col_double(),
##   n_miss = col_double(),
##   alt = col_character(),
##   ref = col_character(),
##   af = col_double(),
##   beta = col_double(),
##   se = col_double(),
##   p_score = col_double(),
##   start = col_double(),
##   rsid = col_character(),
##   vcfstr = col_character()
## )| locus | ref | alt | AF | SNP | p-value |
|---|---|---|---|---|---|
| Chr12: 28,247,840 | C | T | 0.013 | rs192929352 | 1.28e-07 |
| Chr12: 28,249,160 | G | A | 0.013 | rs73080027 | 1.29e-07 |
| Chr12: 28,275,831 | C | T | 0.014 | rs12320589 | 5.77e-07 |
| Chr12: 28,275,948 | A | G | 0.014 | rs73081931 | 5.78e-07 |
| Chr12: 28,437,969 | G | A | 0.013 | rs73083941 | 7.3e-07 |
| Chr12: 78,820,816 | T | C | 0.526 | rs2060031 | 9.1e-07 |
| Chr12: 28,329,758 | G | C | 0.013 | rs73081984 | 9.4e-07 |
| Chr12: 28,334,179 | T | G | 0.013 | rs115527307 | 9.42e-07 |
| Chr12: 28,319,636 | T | C | 0.013 | rs73081974 | 9.77e-07 |
| Chr12: 28,311,049 | C | T | 0.013 | rs115986349 | 9.95e-07 |
| locus | ref | alt | AF | SNP | p-value |
|---|---|---|---|---|---|
| Chr12: 28,247,840 | C | T | 0.013 | rs192929352 | 6.55e-08 |
| Chr12: 28,249,160 | G | A | 0.013 | rs73080027 | 6.57e-08 |
| Chr12: 28,275,831 | C | T | 0.014 | rs12320589 | 2.66e-07 |
| Chr12: 28,275,948 | A | G | 0.014 | rs73081931 | 2.66e-07 |
| Chr12: 28,258,339 | C | T | 0.016 | rs35792578 | 4.18e-07 |
| Chr12: 28,249,612 | C | T | 0.016 | rs11830823 | 4.25e-07 |
| Chr12: 28,249,623 | A | C | 0.016 | rs11835433 | 4.25e-07 |
| Chr12: 28,250,701 | C | T | 0.016 | rs7956083 | 4.25e-07 |
| Chr12: 28,250,549 | A | G | 0.016 | rs7955851 | 4.25e-07 |
| Chr12: 28,249,196 | A | G | 0.016 | rs11835353 | 4.26e-07 |
The top 4 sites in both models are the same: rs192929352, rs73080027, rs12320589, & rs73081931 and are in strong linkage disequilibrium with one another. These sites are located in close proximity to one another on chromosome 12 (Figure 5.17).
![Top four shared SNPs are all located just upstream of the the CCDC91 gene. Adapted from the output of LocusZoom [450].](figs/locusZoom_rs192929352_400kb.png)
Figure 5.17: Top four shared SNPs are all located just upstream of the the CCDC91 gene. Adapted from the output of LocusZoom [450].
Further investigation of these top 4 SNPs with PhenoScanner [451,452] yielded an association with an increased risk of Treatment with ‘oestrogel’ topical estradiol (p-value \(3.79\times10^{-7}\), UK biobank, N=337,159) for SNPs rs192929352 & rs73080027.
The top phenotypes associated with these SNPs in PheWeb [453] also show some overlap (Figure 5.18)
![Phenotypes Common to the top 4 shared SNPs. N = number of the top 4 SNPs in which a term appears in the top 10 Phenotypes Top four that SNP in PheWeb [453].](figs/PheWeb_sets.png)
Figure 5.18: Phenotypes Common to the top 4 shared SNPs. N = number of the top 4 SNPs in which a term appears in the top 10 Phenotypes Top four that SNP in PheWeb [453].
The risk of having many of these disease phenotypes increases with age. Risk of cancer of the gallbladder for instance increases significantly with age with more than half of new cases in the over 75s and peak incedence at 85-89 years according ot cancer research UK [454]. A common feature of ageing progressive sensorineural hearing loss, or presbycusis [455]. Uterine polyps have a peak prevalence in perimenopausal women but have an increased risk of being maligant with age [456]. It is well known that incidence of cardio-vascular disease increases with age and indeed there are more specific changes in cardiac characteristics with age which could related to sinoatrial node dysfunction. Such as reduced vegal control and altered heart rate variability [457] and, a reduced velocity long-axis systolic shortening in the left ventricle suggestive of impaired ventricular relaxation [458]. These SNP associations have biologically plausible associations with Alu age acceleration, however they are plausibly associated with chronological age and the strong correlation between Alu age acceleration and chronological age means these results cannot be interpreted as due purely to Alu age acceleration.
5.5 Discussion
The Alu Age predictors do not fulfill the Horvath & Raj criteria to be classified as an epigentic clock [293], namely that they should have an r > 0.8.
The age acceleration of the Alu age predictors is strongly correlated with age. This may be due the the relatively poor ability of MeDIP-seq to provide absolute quantitation of DNA methylation. There is substantial technical noise in the value representing DNA methylation at a given locus. The observed systematic bias towards underestimating the ages of the young and overestimating the ages of the old may be explained by a broadly consistent direction with an inconsistent magnitude. Simply scaling the value of given locus by a fixed model coefficient when there is a large amount of variation leads to outsized influence of high magnitude outliers on the age estimates. A DNA methylation age clock trained on the entire genome and not restricted to a particular subset such as the Alu elements should yield the optimal age predictor possible using the MeDIP-seq dataset if there is adequate cross-validation when training the elastic net regression. Comparison to this predictor would reveal if the limitations of the Alu age predictor are specific to it or a more general issue with age predictors based on this dataset.
This strong correlation between Alu age acceleration and chronological age means that age is a substantial confounding factor in the GWAS for Alu age acceleration. Consequently the effect of chronological age cannot be readily disentangled from any signature of biological ageing captured by the Alu repeat based age predictors constructed here.
It was an aim of this work to investigate the genetic influences on the Alu clock based measures of age-acceleration, as has been shown previously with an association in the TERT gene with the Horvath clock [459,460]. Interestingly none of the SNPs identified at \(p < 1\times10^{-5}\) in either of the two models was present in the list of those identified in a recent GWAS conducted for the age acceleration of several other DNA methylation age clocks [461]. This could suggest that the Alu Age acceleration signature is associating with distinct genetic effects to those of other DNA methylation base age predictors. These results have the potential to reveal mechanisms involved in controlling the epigenetic state of this large portion of the genome. However the strong relationship with Age acceleration and Chronological age in the Alu clock measures of age acceleration renders this difficult as age is a potent confounder of age acceleration in this instance. The results of the genome wide association study whilst they are suggestive of some interesting age related genetic associations do not necessarily represent associations with age acceleration signatures in the Alu repeat regions of the human genome. A GWAS conducted on Chronolgical Age would likely results that differed between the age strata within the cohort which would not be relevant to the question of biological ageing. Thus the associations in the GWAS for Alu age acceleration could be due to population stratification by age in the GWAS study population. GWAS for Longevity have identified very few consistent results with only APOE and FOXO3 replicating in independent studies [25]. None of 143 unique SNPs from the the 2 GWAS conducted here are shared with the set of top longevity associated SNPs in a meta analysis of longevity GWAS [25].
Direct comparison between DNA methylation array probes and the MeDIP-seq windows used in the Alu clock is not straightforward due to the gaps in coverage of the array, the lack of CpG specific positional resolution and the lack of an absolute unit of methylation level in the MeDIP-seq data. With over a million Alu loci an individually targeted approach to quantifying genome wide Alu element DNA methylation levels would be expensive and impractical. If enzymatic conversion alternatives to bisulfite sequencing methods permit whole genome DNA methylation assays to be performed more cheaply and with longer reads improving mappability [135], then data generated with this approach may permit an Alu DNA methylation clock with greater accuracy in the future.